Unit 5: Pitch, Intervals and Key Areas
Synopsis
Some sounds have an identifiable characteristic that we refer to as its “pitch”, but what exactly do we mean by that, and why do some sounds have this property while others don’t? Pitch is a complex phenomenon; when a vibrating object creates pressure variations in the air that repeat at a fixed rate, we refer to that rate as the “frequency”. Some sounds, like sine tones, consist of a single frequency, which is logarithmically correlated to our experience of pitch. Other sounds, in fact most sounds we hear, consist of many frequencies that fuse together into a single percept. If the different frequencies that comprise a sound vibrate at whole number multiples of a single frequency, we call these sounds “harmonic”, and tend to assign the overall pitch of the sound to that single least common multiple, even if it isn’t present. This harmonic relationship between components, along with other perceptual cues, helps us keep track of a single person’s voice at a party, or a particular instrument in an ensemble, even in complex sonic textures of similar sources. The relationship of the harmonics of one pitch to those of another plays a strong role in our qualitative experience of the musical interval between these pitches, and likewise, these relationships form the basis of our notions of musical keys.
Introduction
The concept of sound frequencies was first introduced in Unit 01. While frequency is a physical attribute which characterizes waves of sound energy, pitch is a perceptual attribute which describes our experience of tones, whether pure (one partial) or complex (several partials). Generally, the higher the frequency of a sound, the higher the perceived pitch. As the spectral composition and temporal development of a sound determine pitch and timbre, an unambiguous pitch percept is only formed for harmonic sounds whose partials have frequencies that are multiples of the fundamental frequency (which also corresponds to the perceived pitch). Inharmonic sounds, in turn, whose partials don’t follow this simple rule, have ambiguous pitch caused by competing virtual pitches.
Pitch
Pitch is thought of as a morphophoric, or form-bearing, medium. This means that patterns of pitch can take on a certain form (i.e. melody) which can be transposed - shifted up or down in pitch - and remain invariant in its perceptual structure. Musically, this accounts for how the same melody can be transposed into different keys and still be recognizable as the same theme.
Frequency and Pitch
Pitch is perceived in sounds that are periodic; i.e. sounds with features which recur at regular frequencies. Aperiodic sounds are more likely to be perceived not as pitches, but as noise or transient (quickly-changing) clicks. Thus, pitch perception depends on frequencies of sounds entering the ears.
The orchestra tunes to the pitch of concert A4, which usually corresponds to sounds with the fundamental frequency of 440Hz. This means that while energy of sound waves may be at 440Hz or above, we perceive sounds to be equivalent in pitch as a pure tone at 440Hz.
Our percept of pitch is logarithmically organized such that an octave above concert A is twice its frequency, therefore, 880Hz; whereas the next octave above 880Hz is twice 880Hz, which is 1760Hz. Thus each octave corresponds to a doubling in frequency, resulting in a logarithmic function relating frequency to pitch.
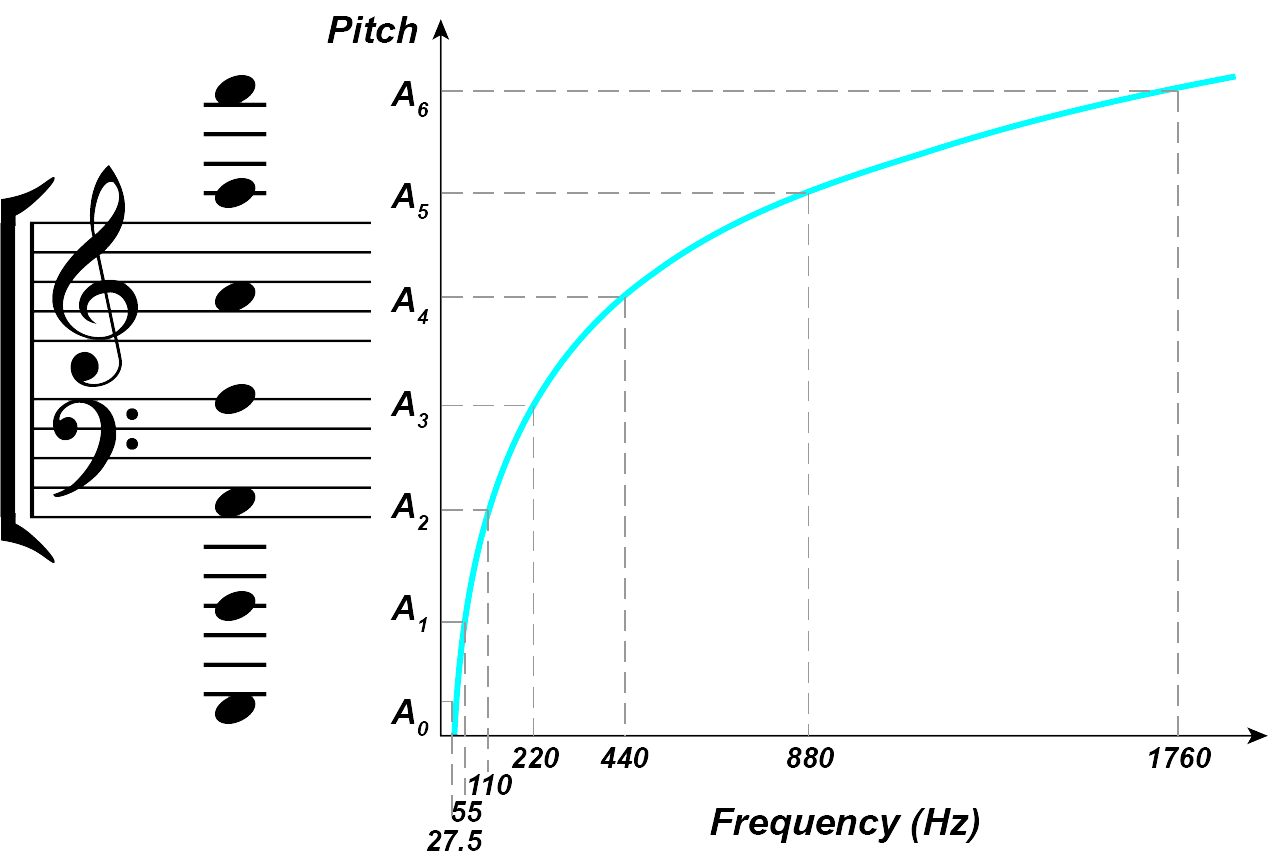
(Image by James Cheung)
Fundamental Frequency
The percept of pitch generally correlates with the fundamental frequency of sound waves. The fundamental frequency is defined as the highest common factor of all sound waves from the same source, which gives rise to the pitch percept.
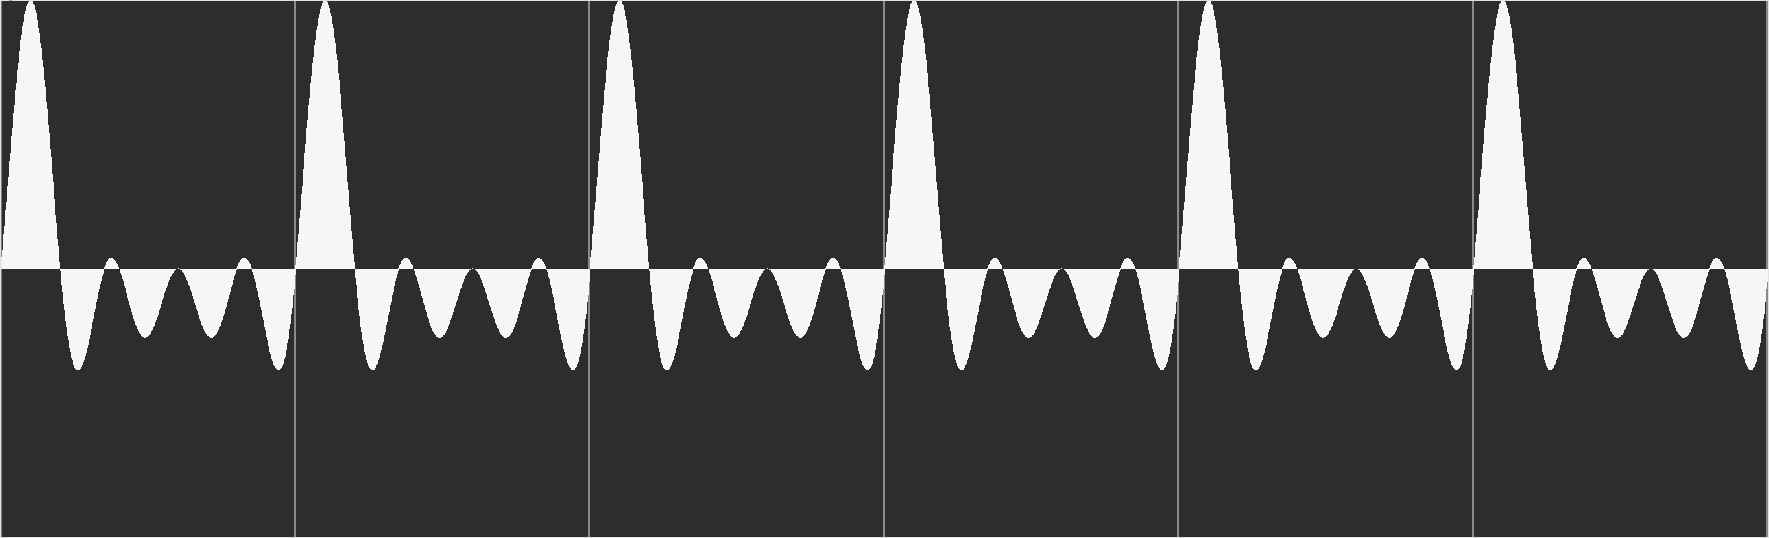
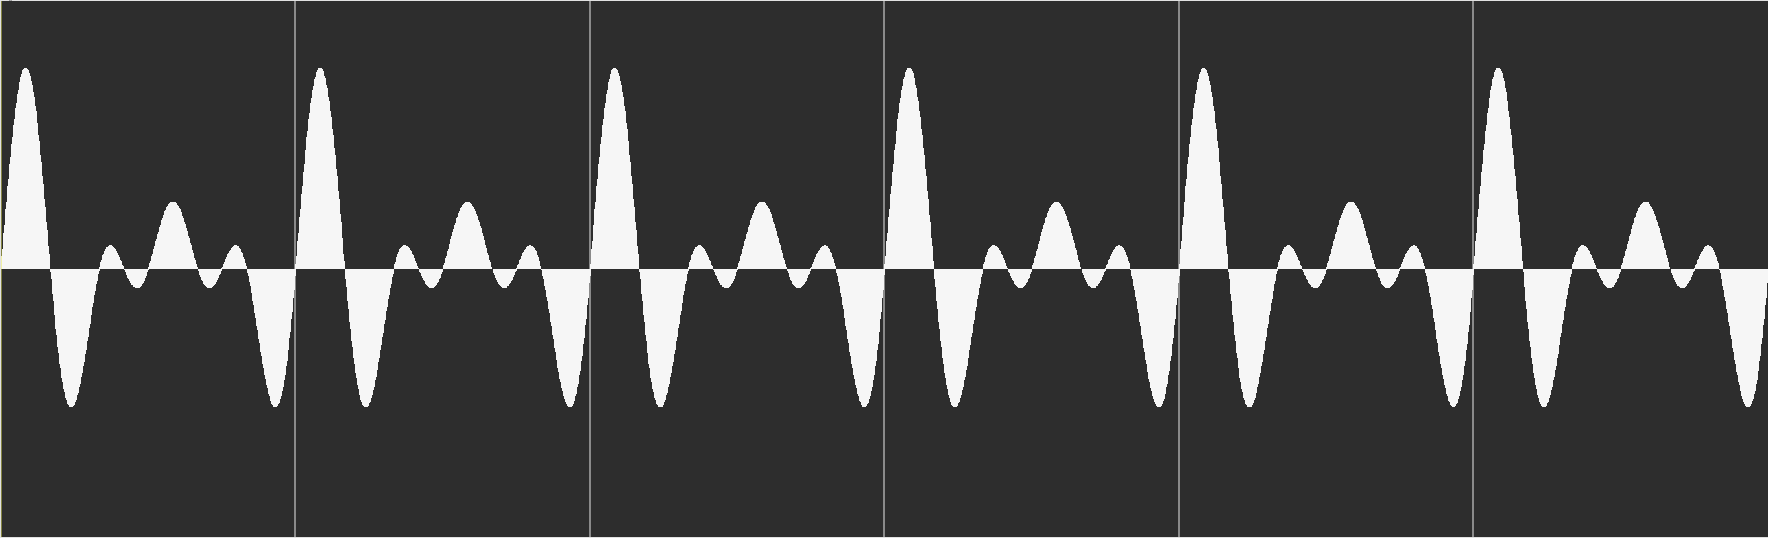
As an illustration of fundamental frequency and its relationship with pitch, consider four tones, each with different numbers of components, but where all the components are integer multiples of 440Hz. The perceived pitch of these four tones should be the same, although the frequencies which comprise them are different. The higher components in frequencies of n times 440Hz do not change the perceived pitch, but they do influence the percept of timbre.
The following are four tones with differing numbers of partials, but with the same fundamental frequency and thus the same perceived pitch.
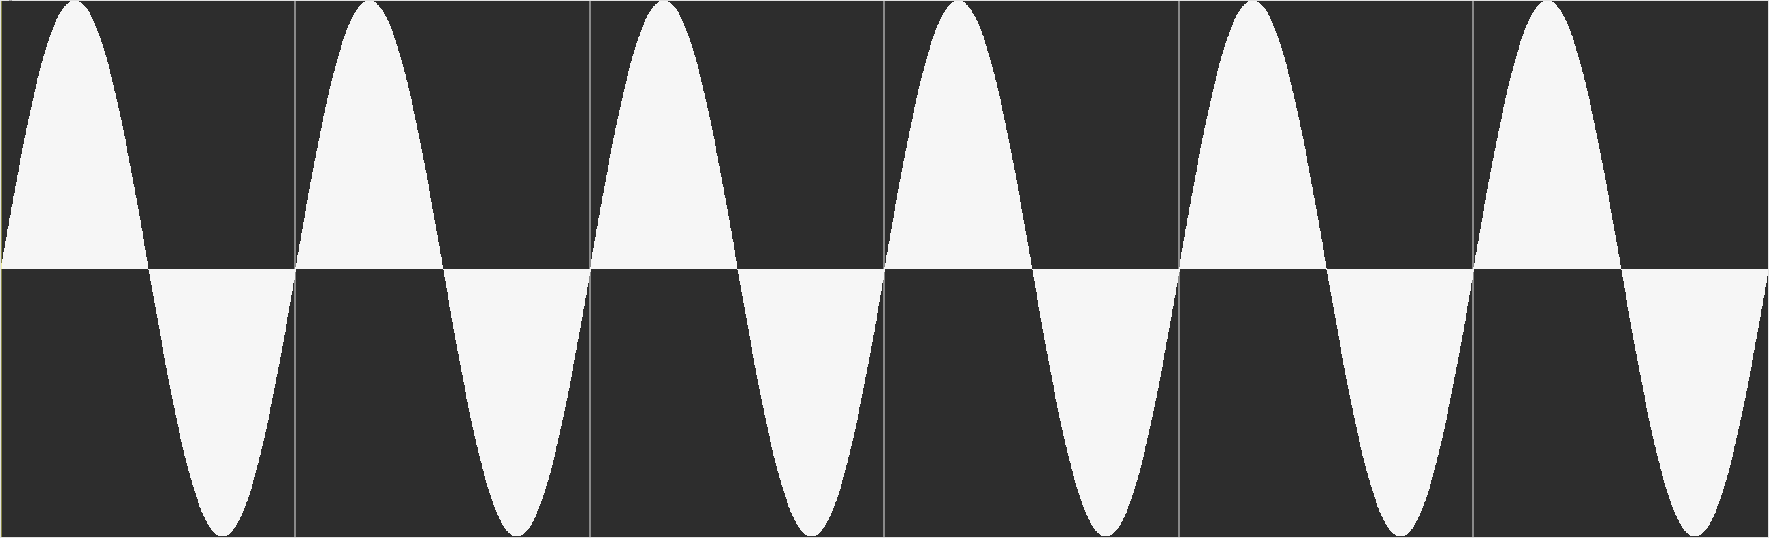
(Image by Georg Hajdu)
|
| |
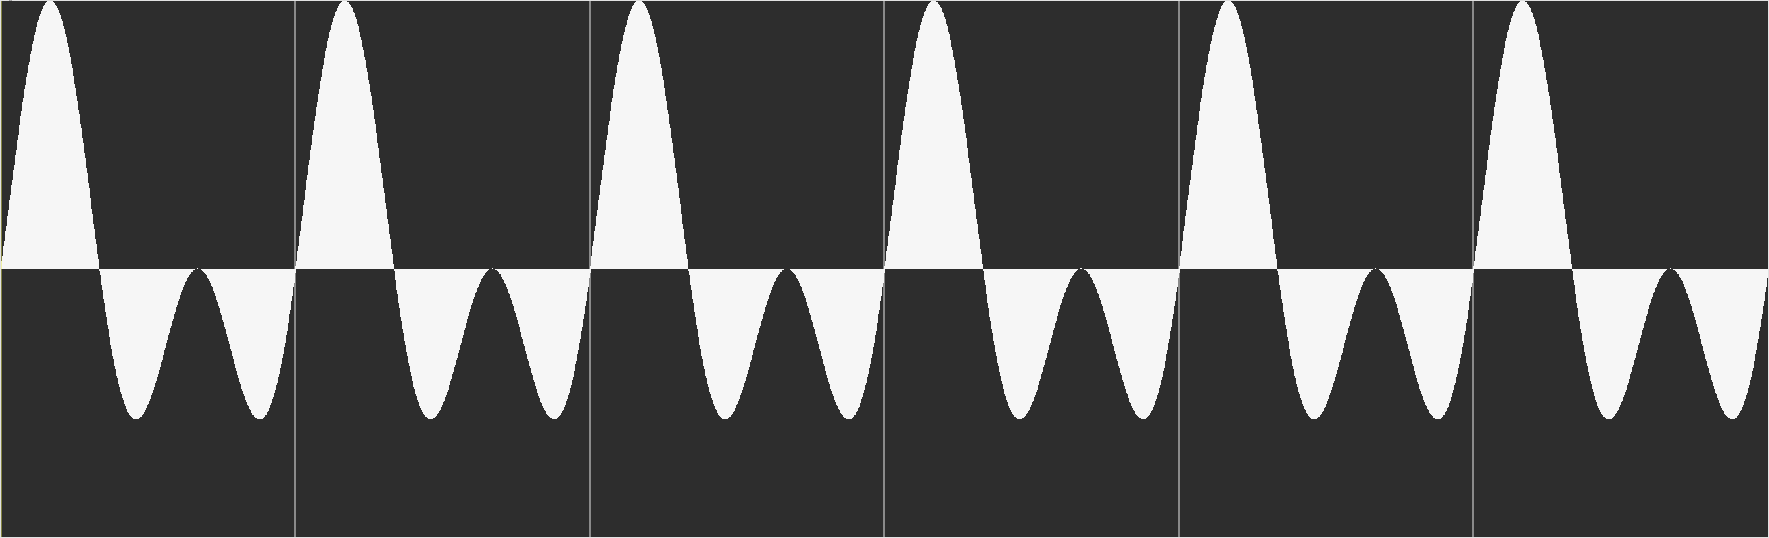
(Image by Georg Hajdu)
|
| |
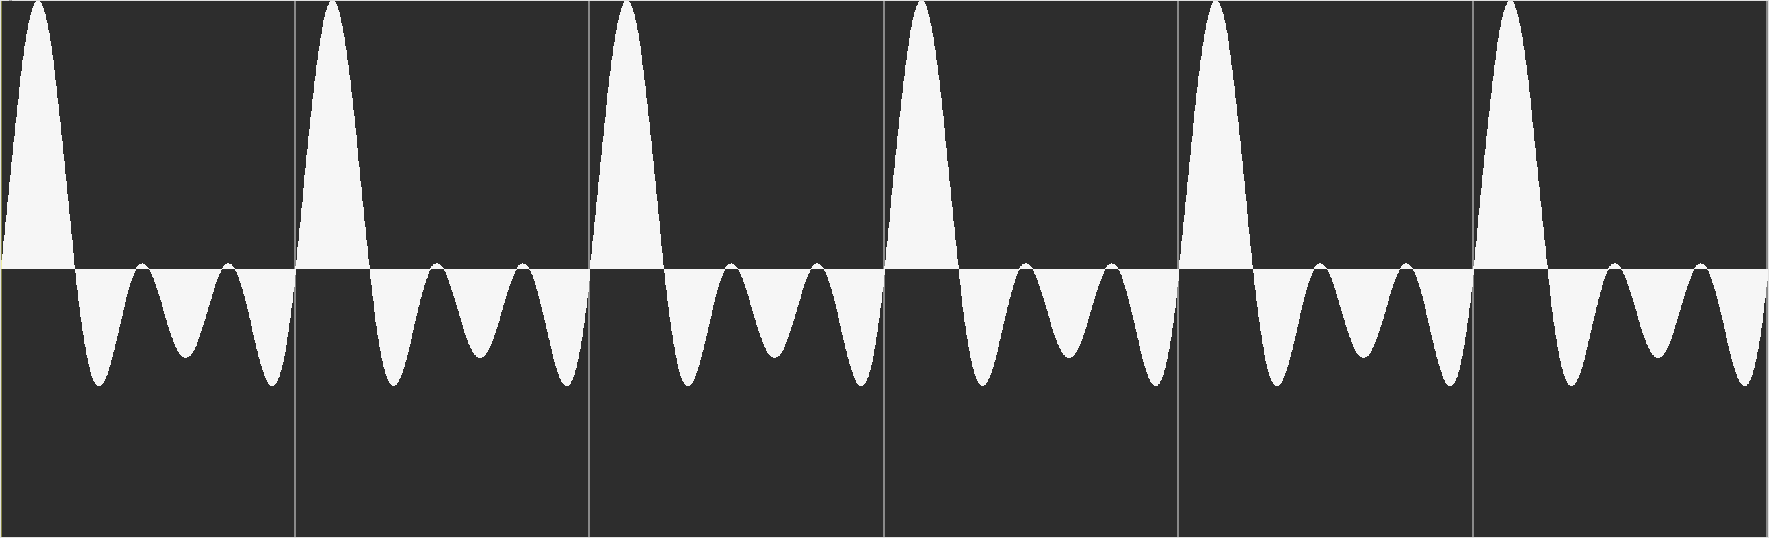
(Image by Georg Hajdu)
|
| |
(Image by Georg Hajdu)
|
| |
(Image by Georg Hajdu)
|
| |
The fundamental frequency of a sound is also known as its periodicity pitch, and is shorthanded as F0.
Virtual Pitch
Sometimes, pitch is perceived at a fundamental frequency even when energy is nonexistent at the frequency of the fundamental. This is known as virtual pitch. Virtual pitch, also known as the missing fundamental, is a classic phenomenon in audition where sound is perceived at a frequency where no energy is present. When energy from harmonic components other than the fundamental is present at integer multiples of the fundamental frequency, the brain is able to infer a virtual pitch at the missing fundamental. Mechanisms that the brain may be using to infer virtual pitch is still an issue of debate, although various models of pitch perception (see below) have been proposed to explain this perceptual phenomenon which is akin to subjective contour in vision. Virtual pitch is only perceived if the missing fundamental frequency lies within the existence region for pitch, which is approximately the frequency range of 30Hz to 3.2 kHz (Pressnitzer et al., 2001).
Virtual pitch demonstrations (from ASA demonstration CD):
Spectral and virtual pitch: you will hear the tune of Westminster chimes presented in virtual pitch, due to the configuration of spectral components harmonically related to the missing fundamental. The spectral and virtual pitches will each be masked in the second and third clips. The video features autocorrelograms of the auditory signal (see below for an explanation). (Video sources: Correlogram Museum)
Strike notes and other curiosities
Terhardt claims that at least three adjacent partials are necessary for the brain to most effectively infer the fundamental pitch in harmonic sounds in the absence of lower partials, such as 6/7/8 or 10/11/12. However, he found that for 11/12/13, the inferred virtual pitch differs slightly from the frequency of the period (F0). This is hinting at a mechanism for pitch detection that takes more than just the periodicity of a signal into consideration. Starting from this observation and the phenomenon of strike notes in bells - pitches clearly perceived but absent from the bell sprectrum -, Terhardt has formulated a theory of pattern recognition of pitch or template theory (see below). Terhardt asserts that, typically, the first six partials are processed to create a stable pitch perceipt.
Pitch Perception Models
For centuries, hearing and musical scientists have attempted to build an optimal model that would account for pitch perception. An accurate model of pitch perception must describe how components of frequencies are converted into pitch in the logarithmic scale; it must also explain how fundamental frequencies are calculated, as well as the phenomenon of virtual pitch. Early pitch perception models fall under two categories: spectral models and temporal models.
Spectral Models
Spectral models of pitch perception, which are based on the frequency spectrum of sounds, tend to start with the Fourier analysis, which convert sound waves into its frequency components. One of the early spectral or place models was proposed by Helmholtz who speculated that each sinusoidal component of a sound triggers sensation at a place coding for pitch. Thus, the ear is a frequency analyzer: Sounds create “resonances” on the basilar membrane triggering nerve impulses.
(Source: Oxenham, 2013)
Temporal Models and Phase Locking
In contrast, temporal models make use of the periodicity of waveforms comprising sounds. According to Schouten, the fundamental frequency can be determined by calculating the time between periodic points in the waveform. Recent research suggests that the brain is capable of locking into the phase of a sinusoid well above 4000Hz.
(Image by Georg Hajdu)
(Image by Georg Hajdu)
Template Theory
Modern theories of pitch perception take into account both spectral and temporal components of sound. Two types of modern pitch perception theories which receive the most support today are the pattern matching models and the autocorrelation models. Pattern-matching models of pitch perception, such as the harmonic template matching model (Lin et al., 1998), postulate that we have stored in our brains a set of templates which, when frequency components are activated, we overlay onto the pattern of activation in order to calculate the fundamental pitch.
Autocorrelation Models
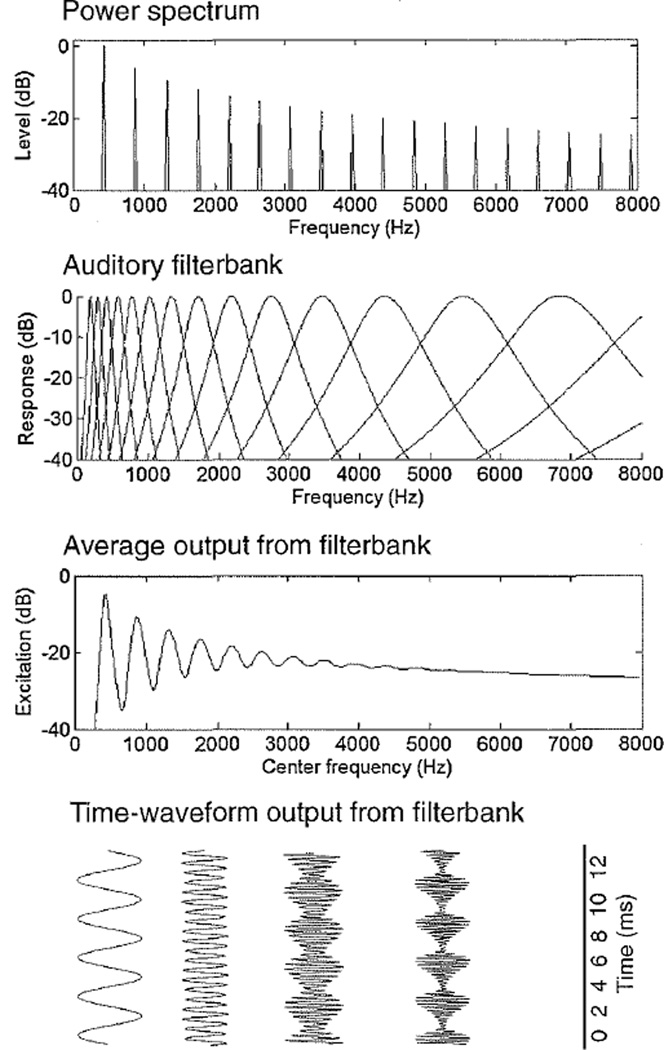
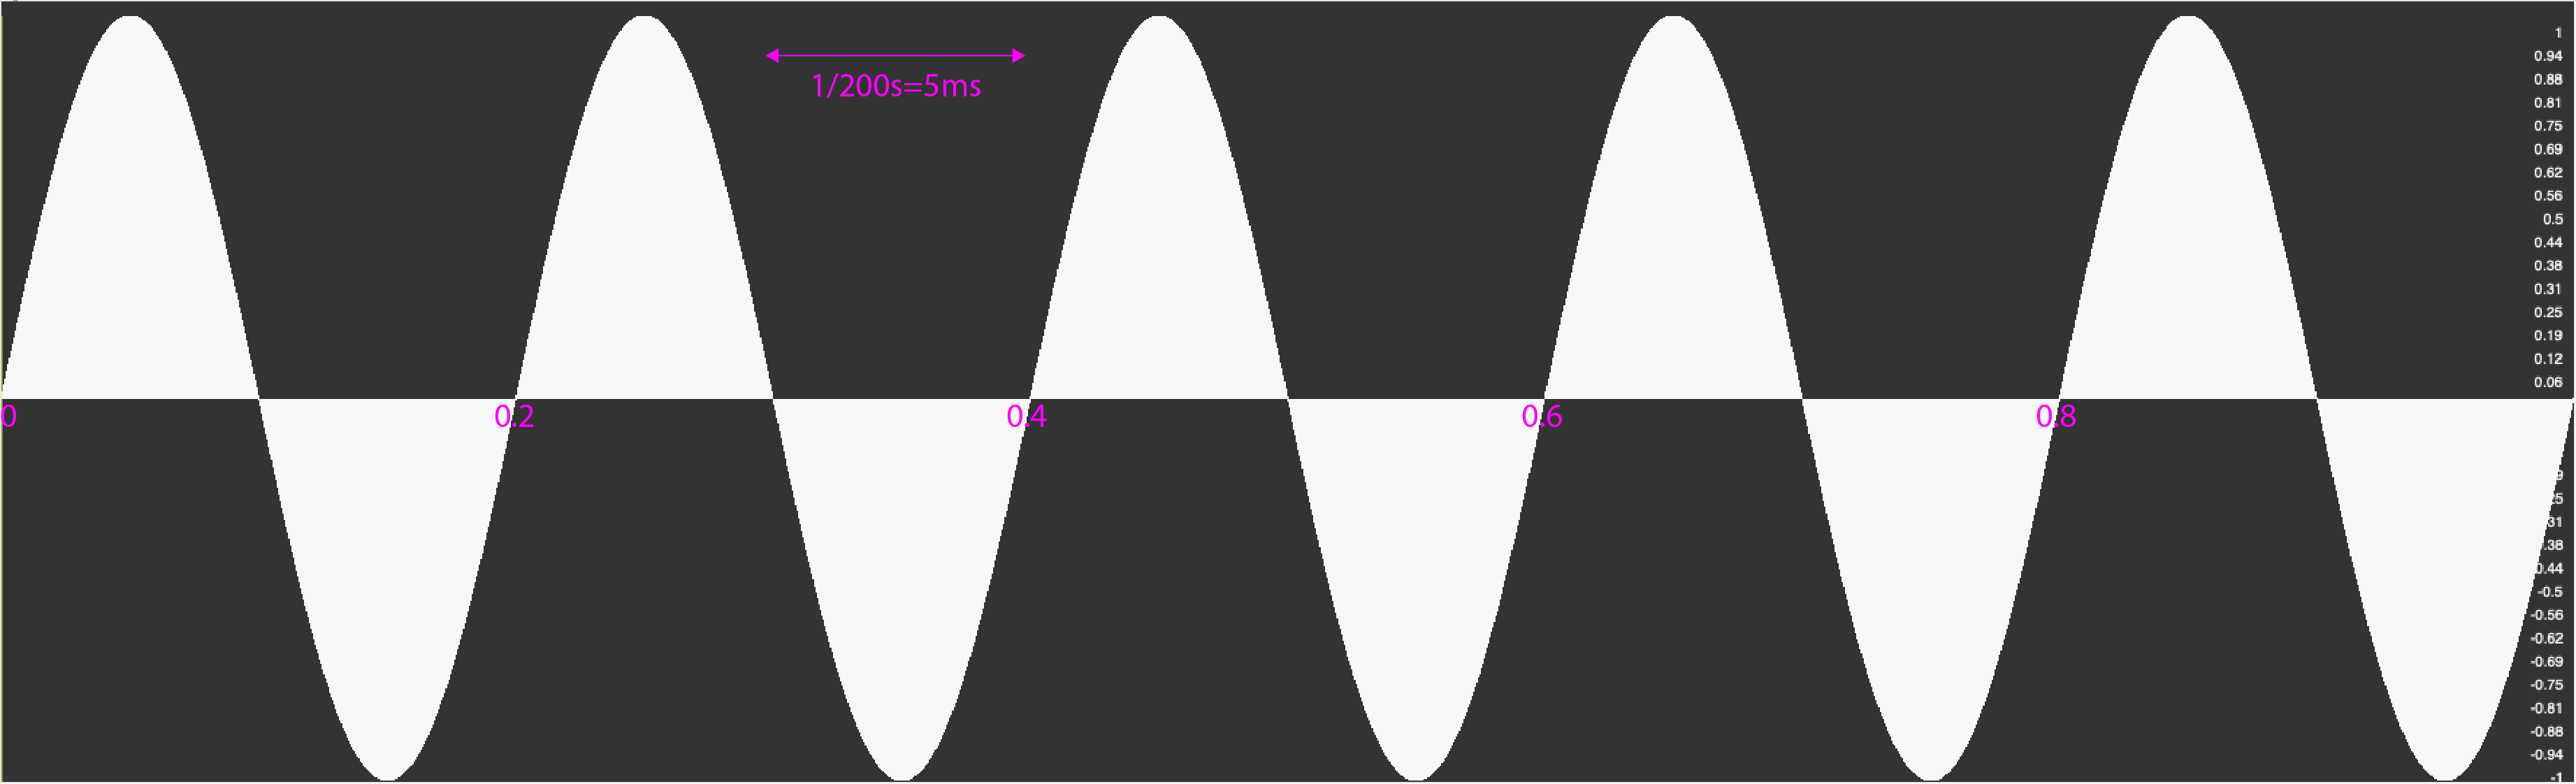
The autocorrelation models (Licklider, 1951), further developed by Lyon, Slaney and Patterson (Slaney et al., 1993) use a measure of self-similarity of a waveform in order to derive its fundamental. It is based on the idea that a periodic waveform, when phase-shifted to exactly one period of its fundamental away from a starting point, should correlate perfectly with itself. By comparing the time lag between perfectly correlated frequency components, the model can derive the period of the complex sound, and thus the fundamental frequency. These models give credibility by being capable of explaining typical miscalculations of the auditory system which, by instance, arise when detuning lower partials of a harmomic sound or transposing down sounds consisting of odd partials only.
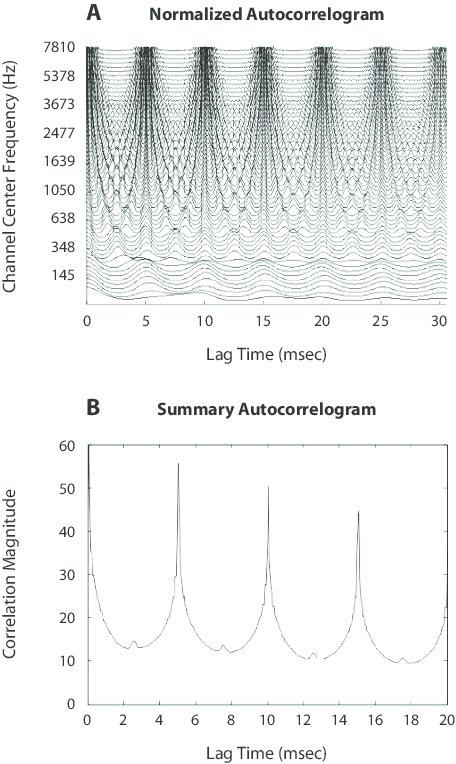
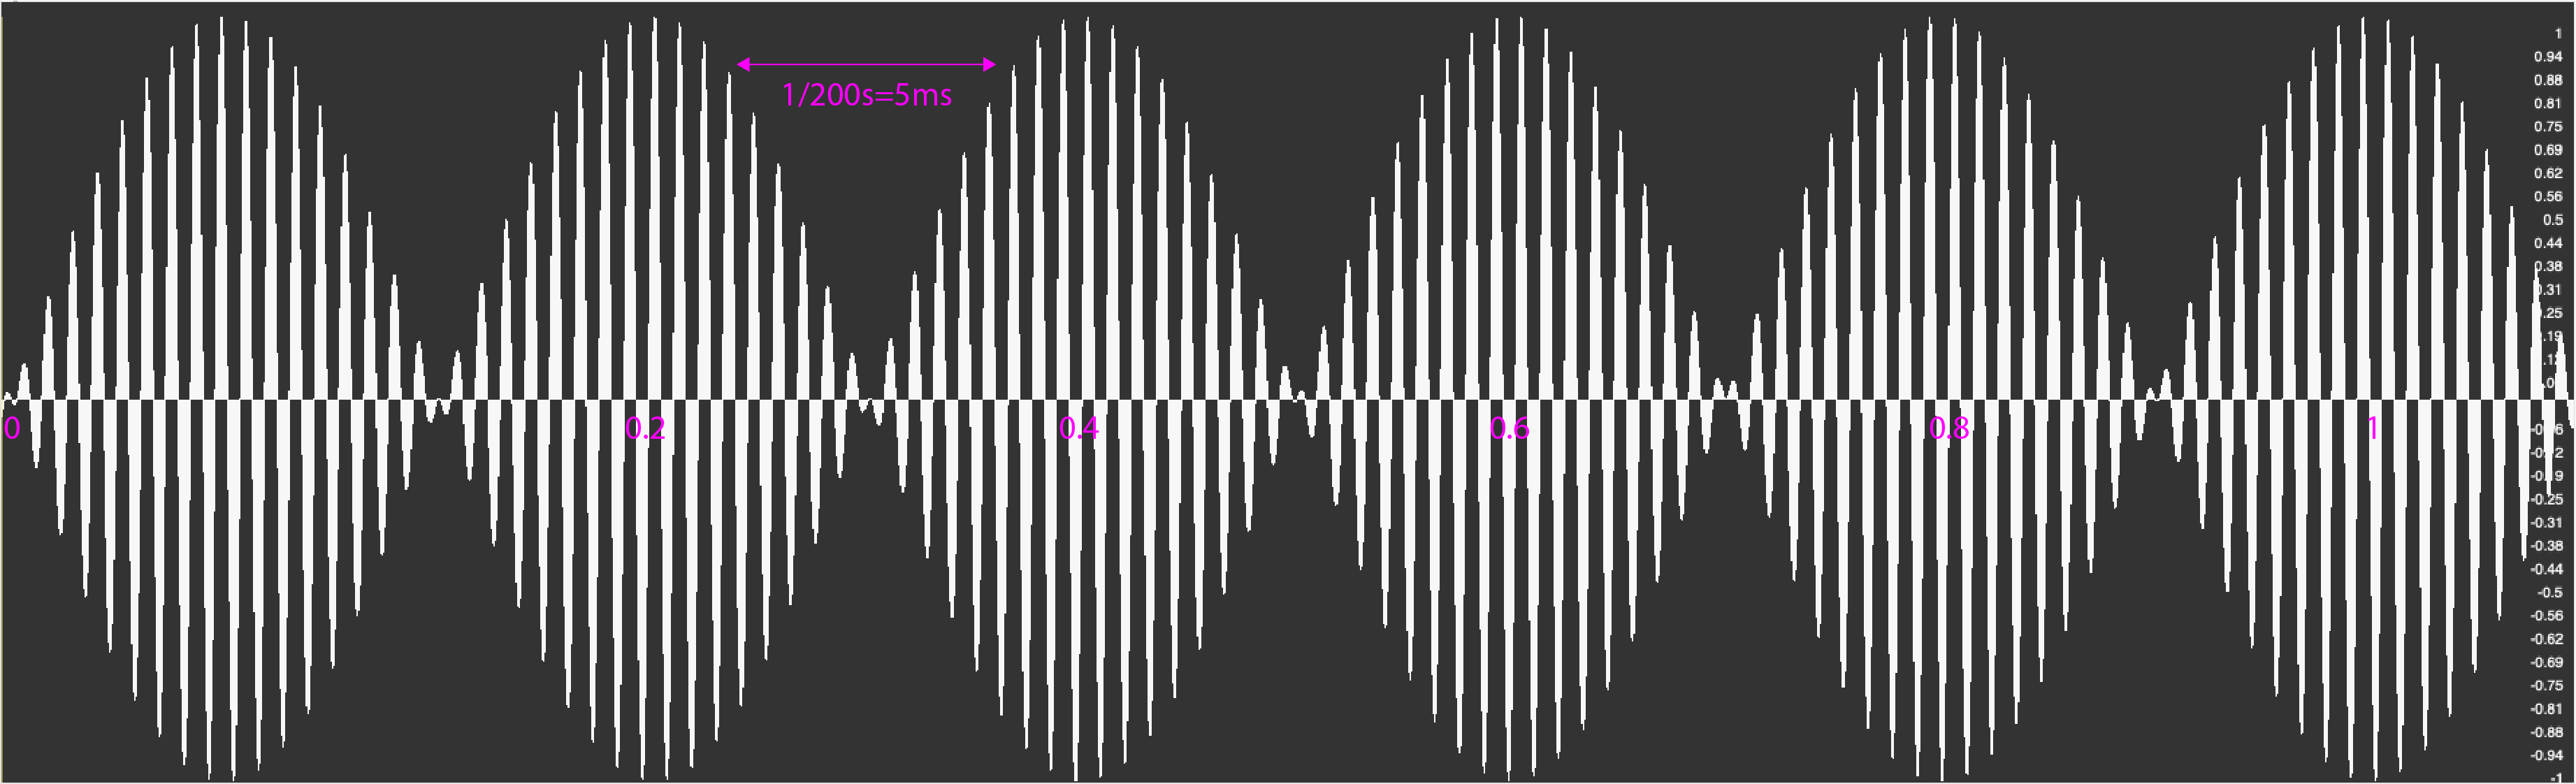
The autocorrelogram (A) for a 200-Hz-fundamental harmonic complex computed by taking the autocorrelation in each channel The high correlation every 5 msec is used to predict a 200-Hz pitch (reciprocal of 5 msec) for this stimulus. Panel B depicts the summary autocorrelogram for the 200-Hz-fundamental harmonic complex obtained by summing the correlations across channels for the autocorrelogram shown in panel A.
The debate between pattern matching and autocorrelation models have received widely discussed among hearing researchers in recent years. While new data continues to emerge in support of either model, results from neuroscience looking for autocorrelators or harmonic templates in the auditory system may contribute to resolve these debates.
Cognitive Models of Pitch
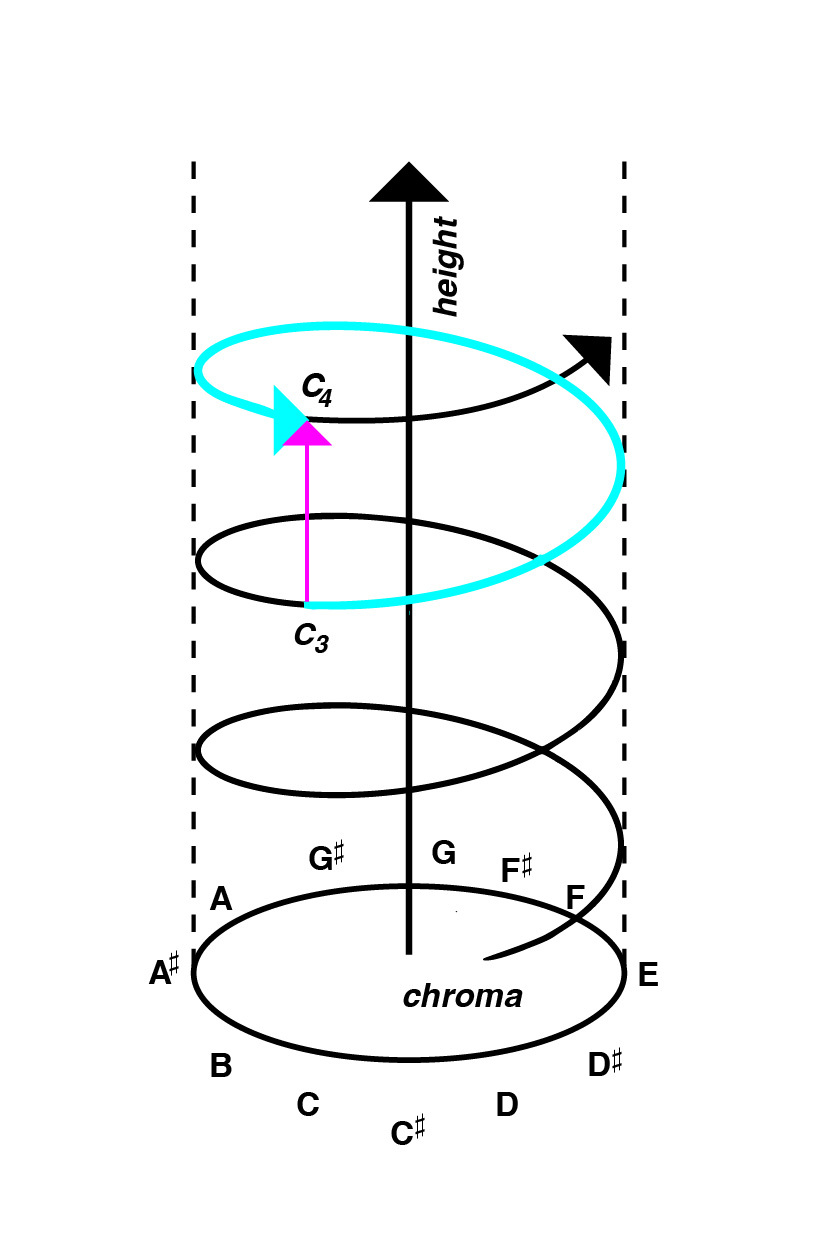
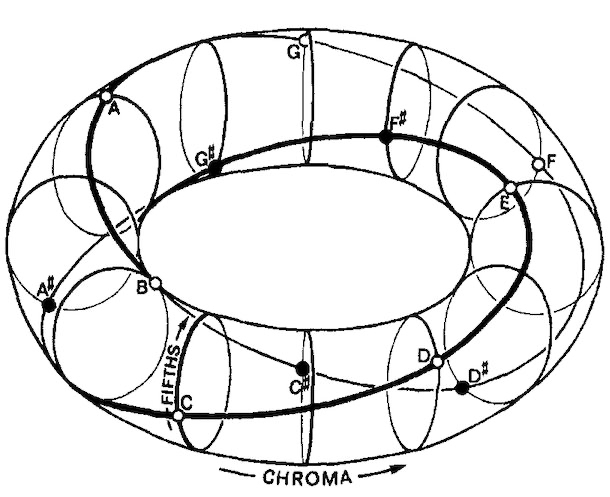
American psychologist Roger Shepard has developed a cognitive psychological model that represents pitch in a helix. In this case, the circular chroma circle (horizontal) can be distinguished from height (vertical). Octaves are always on the same side of the helix. By a clever construction tones can be formed, in which the dimension of the height is eliminated. These sounds, called “Shepard tones”, are useful for constructing auditory illusions, e.g. endlessly rising or falling glissandi or scales.
(Image by Janina Luckow)
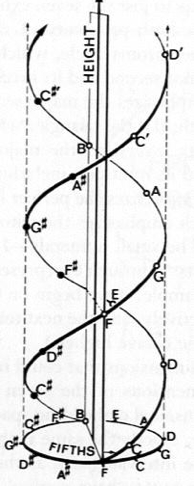
Taking the importance of fifths into consideration, Shepard extended his model to a double helix.
A five-dimensional model projecting the helix onto a torus accounts for third-relationships and the closed circle of fifths.
Evidence that pitch chroma and pitch height activate different parts of the brain come from (Warren et al., 2003) who showed that changes in both chroma and height activate the auditory cortex, but changes in pitch chroma activate regions anterior to the regions activated by pitch height changes.
Research in gerbils (a small rodent) and humans also found a double-helical structure in the lateral lemniscus (VNLL, a region located in the brainstem) that “might play an important role in peridiocity analysis” (Langner, 2015) and has thus been labeled the auditory double helix.
Intervals
Intervals arise when two pitches are either played in succession or simultaneously. The mathematical relationship of an interval created by the frequency ratio of two pitches is given by this formula:
\begin{equation} I=1200\cdot log_2(\frac{F_1}{F_0}) = 1200\cdot \frac{log_{10}(\frac{F_1}{F_0})}{log_{10}(2)} \label{eq:FrequencyToPitch} \end{equation}
Replace F1 and F0 by integer numbers and get the result by entering the formula into a calculator or browser. The unit for I is cents — one cent being a 1/100th of a semitone.
Intervals are constituents of scales, melodies and harmonies and are judged according to their tonal stability. Music theory differentiates between perfect consonances, imperfect consonances and dissonances. It has been shown that these categories are not stable and have changed over the course of music history; and therefore shouldn’t be confounded with sensory dissonance - a bottom-up phenomenon arising in the inner ear.
Table 5.1 lists the intervals of the chromatic scale derived from the harmonic series in comparison to the tempered 12-tone scale. Devations can be as much as 17 cents for the tritone and as little as 2 cents for the fifth.
| Interval (Name) | Frequency ratio | Interval (Size in Cents) | Size of Tempered Interval |
| unison | 1/1 | 0 | 0 |
| minor second | 16/15 | 112 | 100 |
| major second | 9/8 | 204 | 200 |
| minor third | 6/5 | 316 | 300 |
| major third | 5/4 | 386 | 400 |
| just fourth | 4/3 | 498 | 500 |
| tritone | 7/5 | 583 | 600 |
| just fifth | 3/2 | 702 | 700 |
| minor sixth | 8/5 | 814 | 800 |
| major sixth | 5/3 | 884 | 900 |
| minor seventh | 16/9 | 996 | 1000 |
| major seventh | 15/8 | 1088 | 1100 |
| octave | 2/1 | 1200 | 1200 |
The Fifth as the Generator of Tonality
The fifth (3/2) occupies an outstanding position in almost all musical cultures. In contrast to so-called imperfect consonances such as thirds and sixths, deviations of the fifth are not well tolerated by listeners. The fifth and its compound variant, the just twelfth (3/1), have a similarity to the octave whose tones are perceived as equivalent.
The special significance of the fifth manifests itself in the fact that it appears in four different categories of music and is thus indicative of the holistic, self-similar or fractal nature of tonal music.
- Harmonic Series
- Intervals of Complex tones
- Function: tonic - dominant
- Key Areas: C major - G major
Heinrich Schenker has developed an analysis method (Schenkerian analysis) demonstrating that nearly every piece of tonal music can be reduced to a simple tonic - dominant - tonic relationship (ursatz).
Tonnetz
Just as Shepard’s 5-dimensional model, the Neo-Riemannian tonnetz is capable of representing fifth and third relationships. The tonnetz is frequently used in music theory to represent harmonic progression.
(Animation source: Davidwbulger. Copyright: Public domain)
Tonality and Probe Tone Method
Roger Shepard and his student Carol Krumhansl developed the Probe Tone method, aimed to explain the notion of tonality. Tonality is a hierarchical phenomenon in which the tones arranged in a system have varying amount of tension with each other. This raises the not yet fully answered question, whether the types of sound used in music (for example, with harmonic partials) ultimately determine how the music manifests itself.
In this method, subjects listen to cadences and scales, with the target sound (the tonic) being replaced by a so-called probe tone. The subjects are asked on a scale of 1 to 7 to judge how well the probe tone “fits”.
By analyzing the data, three groups emerged which, depending on their musical background, were more or less able to perceive tonal hierarchies in major or minor context (the figure on the right shows results typical of experienced musicians).
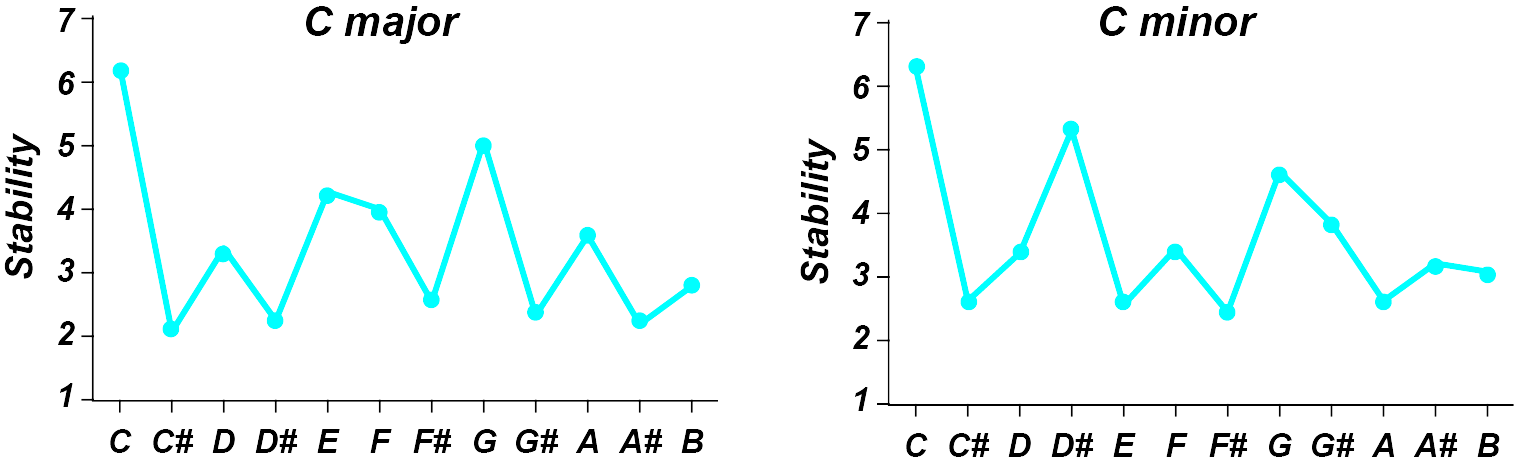
(Image by James Cheung. Adapted from (Krumhansl, 1990))
Key Space
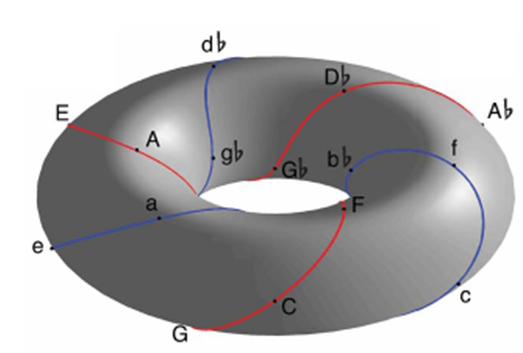
Another view of pitch and tonal material looks at harmony and key changes in addition to single pitches. Krumhansl, Kessler & Bharucha (Krumhansl, 1990) found that dissimilarity judgments of pairs of chords map best onto a torus. The toroidal representation allows different tonal relations to map along the different planes of the torus, such that the C major key, for instance, is closely related to G major (circle of fifths), a minor (relative minor), and c minor (parallel minor).
The arrangement of the 24 keys on the surface of a torus can now be derived from the experimentally obtained data by Multidimensional Scaling. Multidimensional scaling is a process capable of constructing a two-dimensional map from a list of distances (such as the route New York - Tokyo or Melbourne - Berlin). Taking now the tonality profiles as the starting point for all 24 major and minor keys, the comparison of the profiles yields a map depicting the distances (i.e., degree of relationship) of the keys as points on the surface of a torus (“donut”). It is noticeable that the two fifths (major = red, minor = blue) spiral around the torus.
Janata et al (2003) found neural correlates of movement on the surface of the torus in the ventromedial prefrontal cortex. Stable voxels over many scanning sessions, but unstable as to which voxels correspond to which area in tonal space (key). It is as if the torus moves around in your head over different days. Video showing continuously modulating melody activating the surface of the torus.
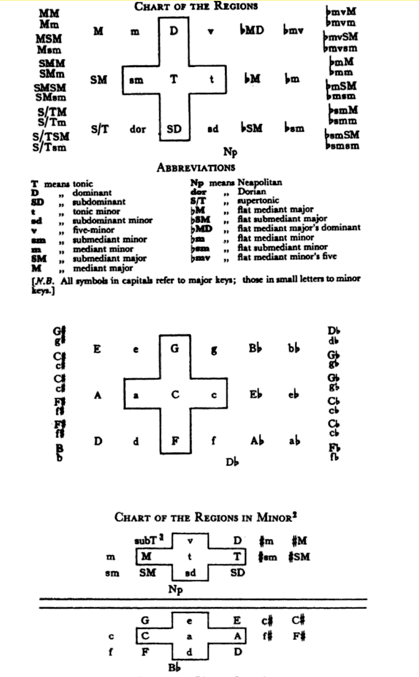
Interestingly, Arnold Schönberg in his book “Structural Functions of Harmony” devised a chart of key regions which is strikingly similar to the torus unfolded into two dimensions.
Applications of Key Space
Music Generation
At the University of California, Berkeley, David Wessel has inspired the development of a Max patch that uses the opposite approach: users move their mouse over the surface of the torus, controlling a generative process that generates profiles according to the melodies; the height of each bar for a given tone determines the frequency of its appearance. This makes it possible to continuously modulate from key to key. In the lower illustration, the torus has been cut in two dimensions and “laid flat”.
Music Analysis
With the help of Krumhansl’s model, when playing (tonal) music, it is possible to determine which key is currently predominant and how the music moves across the surface of the cut-open torus. The zones become brighter, the clearer the sense of tonality is. In the animation, the chord changes in a song by Antônio Carlos Jobim) are visualized by the AudioKeySOM software by Petri Toiviainen.
(Video by Petri Toiviainen)
Quiz
Calculate the sizes of following intervals. Pythagorean major third (81/64), septimal minor seventh (7/4) and undecimal augmented fourth (11/8). Determine how much they deviate from their equal-tempered counterparts.
The calculation of virtual pitch was attributed to cubic difference tones in past which, strikingly, yield similar results. Explain why the brain will most likely still use a different method and give an example where difference tones and virtual pitch differ.
Discuss to what extent the tonality profiles derived by the probe tone method point to universal musical principles or whether it’s rather cultural influences that determine the perception of tonal hierachies.
References
- Pressnitzer, D. & Patterson, R. & Krumbholtz, K. “The lower limit of melodic pitch”. Journal of the Acoustical Society of America, 109(5): 2076-2084. 2001.
- de Cheveigne, A. “Pitch perception models”. In Pitch, Plack, C. and Oxenham, A. (eds.). Springer Verlag. 2004.
- Krumhansl, C.L. “Cognitive foundations of musical pitch”. Oxford University Press. 1990.
- Licklider, J.C.R. “A duplex theory of pitch perception”. Journal of the Acoustical Society of America, 23(1): 147. 1951.
- Lin, JY & Hartmann, W.M. “The pitch of a mistuned harmonic: Evidence for a template model”. Journal of the Acoustical Society of America, 103: 2608. 1998. 10.1121/1.422781
- Patterson, R.D. & Allerhand, M.H. & Giguere, C. “Time‐domain modeling of peripheral auditory processing: A modular architecture and a software platform”. The Journal of the Acoustical Society of America, 98(4), 1890-1894. 1995.
- Schoenberg, A. & Stein, L. “Structural Functions of Harmony”. WW Norton & Company. 1969.
- Shepard, R.N. “Geometrical Approximations to the Structure of Musical Pitch”. Psychological Review 89(4). 1982.
- Slaney, M. & Lyon, R.F. “On the importance of time-a temporal representation of sound”. Visual representations of speech signals, Cooke, M., Beet, s., and Crawford, M (eds.), pp. 95-116. 1993.
- Warren, J.D. & Uppenkamp, S. & Patterson, R.D. & Griffiths, T.D. “Separating pitch chroma and pitch height in the human brain”. Proceedings of the National Academy of Sciences, 100(17), 10038-10042. 2003.
Authors
Topics
- Pitch
- Interval
- Theory of Pitch Perception
- Tonality
- Key Area