Unit 3: Fundamentals of Psychoacoustics
Synopsis
Do we all experience sounds the same way? One of the reasons sound is such a complex topic is due to the ways in which it interacts with our environment, whether that’s a concert hall, a classroom, or a forest. As it radiates away from its source, the materials it encounters along the way (surfaces, objects, our bodies) change its quality as well as its direction, and give us information about not only the source, but our environment. This means that even subtle changes in position, such as rotating our heads slightly, can dramatically affect the way we experience a sound source. Once the sound does reach our ears, it passes through a complex array of materials (tissue, bone, fluid, hair) before finally becoming available for processing by the brain in the form of electricity. At this point, higher level cognitive processes help us to make sense of the sound—what it is, where it is, and what it might mean. Ultimately, the judgements we make about sound help us make sense of our environment, but at the same time, they are also subject to what we already know. Because we are always gathering knowledge about our environment, certain cues from the auditory stimulus that suggest impossible scenarios, for example a sound source that seem to be in two places at once, can be overridden by higher-level cognitive processes as we integrate information.
Introduction
In the previous unit we introduced various physical properties of the sound stimulus. We saw that frequency, amplitude, phase, temporal envelopes, and spectral envelopes are all useful descriptors of sounds, and that different visual representations may contain useful information about these sound properties. But how do these physical descriptions relate to how you actually hear? In other words, how does our perception of a physical stimulus depend upon its context? In this unit we are primarily concerned with how sounds interact with the world, and the ways with which they can be influenced by our long-term knowledge and understanding. One important distinction we make is between the Bottom-Up and Top-Down perspectives of perception. Bottom-Up processing gives rise to some signal processing (such as the extraction of frequency, reverberation, and some issues explored in Elementary Psychoacoustics. Loudness perception and room acoustics are two topics that receive important information from the Bottom-Up perspective, but are heavily dependent on Top-Down knowledge as well. This unit will also investigate the cases involving mismatch between Top-Down and Bottom-Up signals, which give rise to the Precedence Effect, the Ventriloquism Effect, and other perceptual phenomena and illusions.
Sound Ecology
In the natural world, sounds rarely occur in complete isolation. Our sonic environment, or soundscape, consists of combinations of sounds that may include intentional signals as well as sounds that are produced as a result of interactions with the environment. Aspects of the soundscape may contain useful information about the world. One example is reverberation, which is produced by the interaction of a sound with its environment, and the listener can use reverb to infer information about the size and shape of the room.
An analogy of the auditory system’s ability to construct a picture of the world can be drawn from the following scenario.
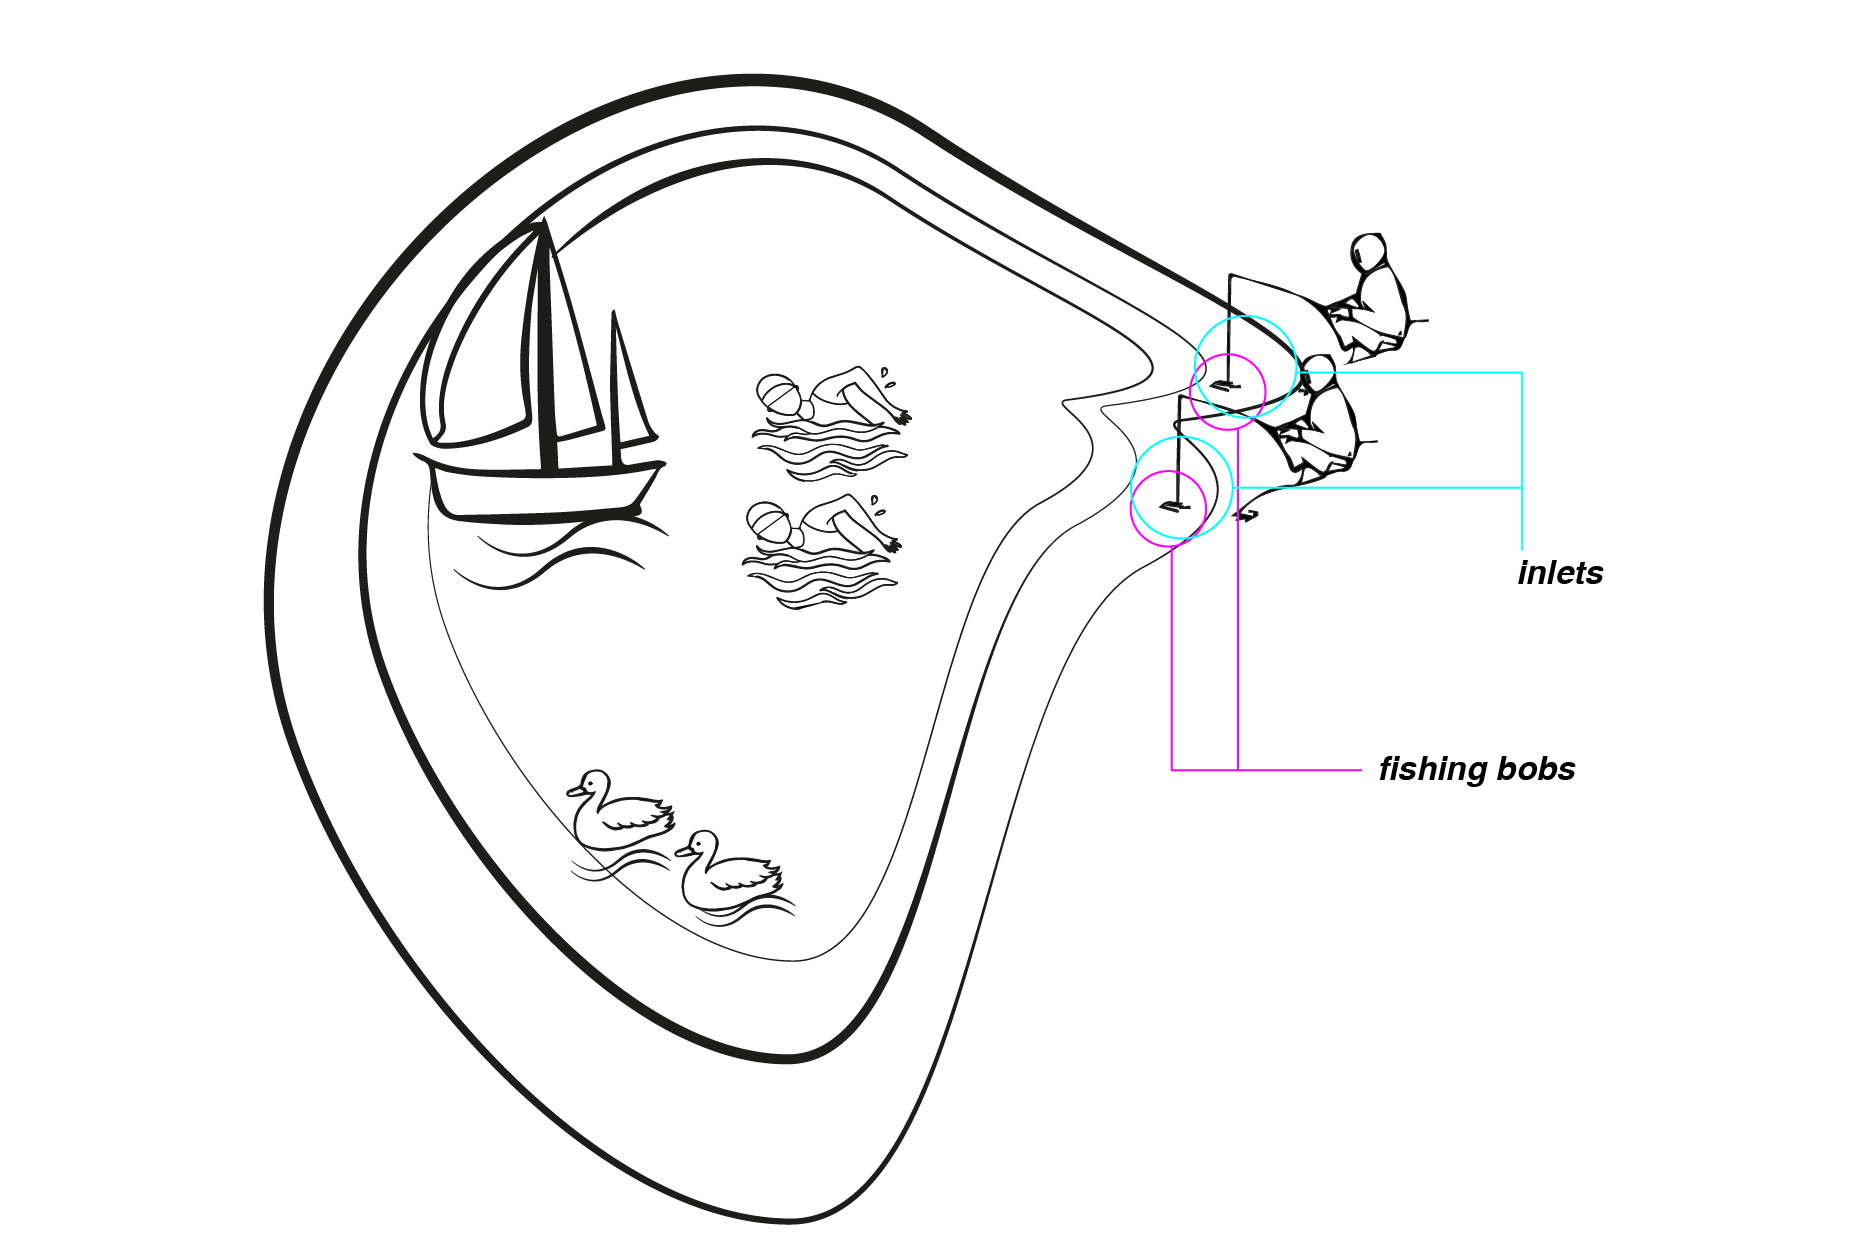
(Image by Janina Luckow)
Here is the surface of an irregularly-shaped lake, with two inlets coming out of its side. A fishing bob is floating on each of the inlets. Now suppose you are only allowed to look at the fishing bobs, but you must answer the following questions:
- How many ducks are there?
- Which way are the people swimming?
- Which is closer to you, the sailing boat or the swimmers? When only given information from the two fishing bobs, it may seem impossible to answer all these questions. Surprisingly, our auditory system seems to have little trouble given a similar problem. Although we have only two ears, the information we can glean from these two input receivers is powerful enough to infer many things about the environment. The auditory system’s ability to use sounds to understand the environment is termed by Bregman (1990/1994) as Auditory Scene Analysis.
Elementary Psychoacoustics
Much of the findings we present in this course come from studies in psychoacoustics. Psychoacoustics is the study of hearing and sound. This includes the study of the mechanisms enabling the auditory system to detect and identify sounds, and the roles of various aspects of sound on auditory perception. The study of psychoacoustics is predicated upon knowledge of the signal. This entails a characterization of parameters such as the amplitude, source location, and spectral and temporal properties of the sound stimuli. Knowledge of the sound signal is necessary for answering questions that can be raised in order to understand hearing. For example, here is one simple question that a psychoacoustician might ask: how loud does a tone have to be before it is heard? This question can be addressed using a simple signal detection test, where the listener is presented with many trials. Each trial may contain either a tone in a noisy background (signal-plus-noise trial), or background noise only (noise trial). After hearing each trial, the listener must decide whether they heard a noise trial or a signal-plus-noise trial. This test, known as the tone-detection-in-noise task, is one of the simplest of psychoacoustical methods. The accuracy of the listener’s performance, as measured either by the percent of correct responses (PC, or Percent Correct) or by the listener’s sensitivity ($d\prime$ score, or discriminability as determined by SignalDetectionTheory methods), gives the psychoacoustician an idea of the signal-to-noise ratio necessary for a listener to reliably detect the tone. As you can see from the discussion in this unit on LoudnessPerception, the answer to such a simple question can be a complex one, and may depend on other variables such as the frequency and location of the signal.
Some other questions psychoacousticians might ask are: (according to psychoacoustician Chris Plack) How do we separate sounds occurring simultaneously (e.g. two speakers speaking at once)? How do we localise sounds in space? How do we determine the pitch of a musical instrument? These questions have obvious importance for composers and musicians. Later chapters will investigate more of these questions in detail.
Signal Detection Theory
Threshold-finding models addressing this question have given way to the use of Signal Detection Theory to obtain a reliable criterion of signal detectability. Signal Detection Theory provides a bias-free measure of sensitivity to any stimulus.
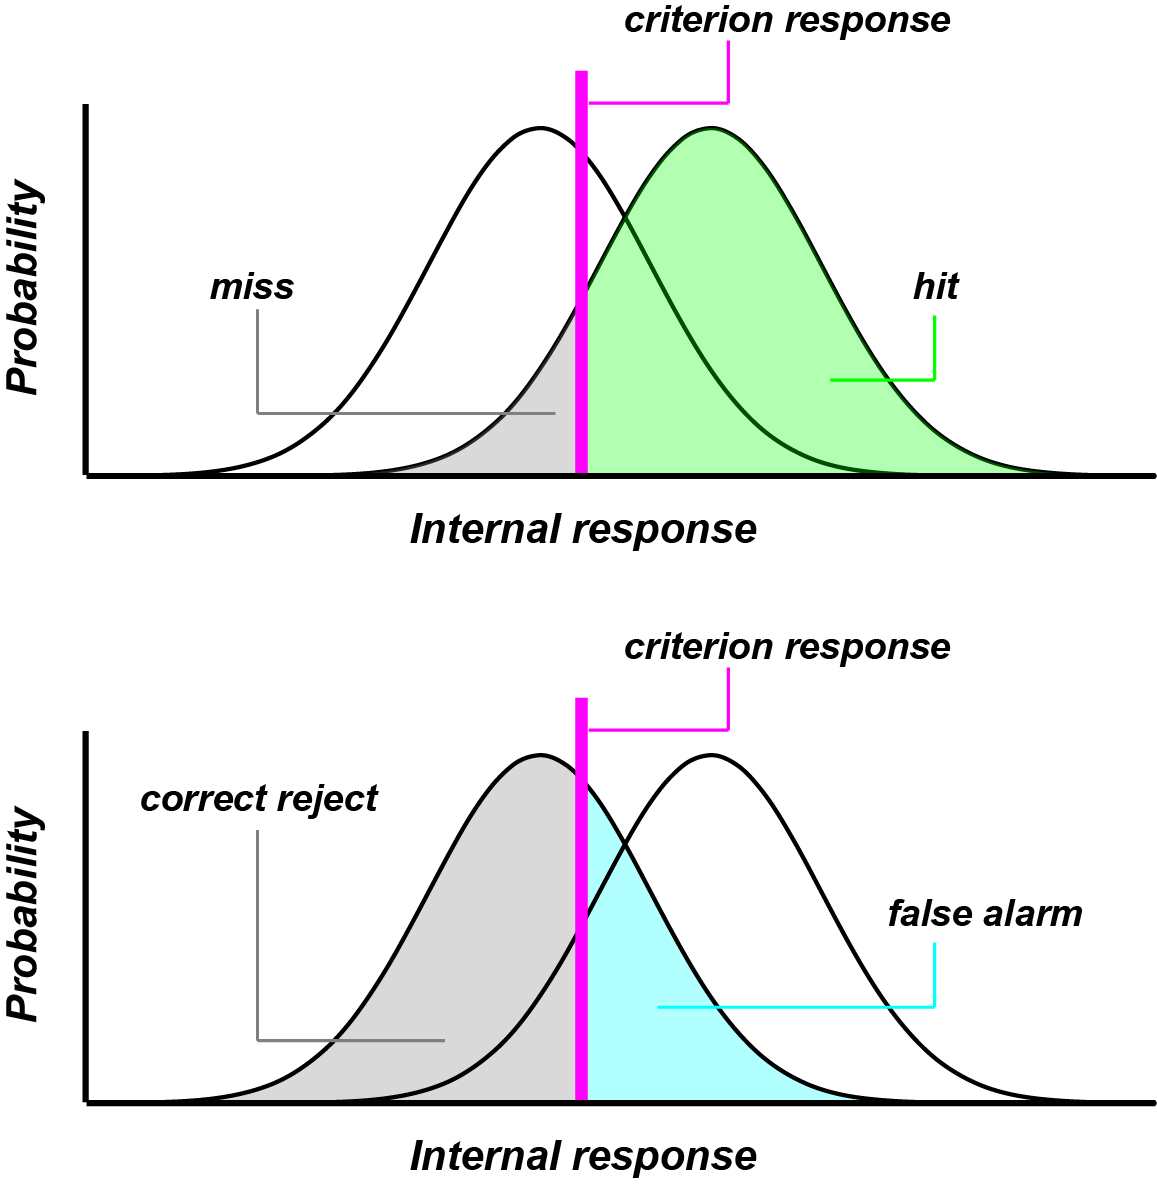
Simple signal detection theory assumes two Gaussian distributions of signal trials and noise trials respectively. Given some amount of evidence of the signal, plotted on the $x$ axis (or “internal response” as shown in the graph), the observer must decide on the probability that the evidence points to a signal trial or a noise trial. The observer then adopts a criterion (shown as the thick line labeled “criterion response”). Any trial for which the internal response exceeds the criterion is categorized as “signal”, and any trial for which the internal response is below criterion is categorized as “noise”.
(Image by James Cheung. Adapted from: Heeger, 2003)
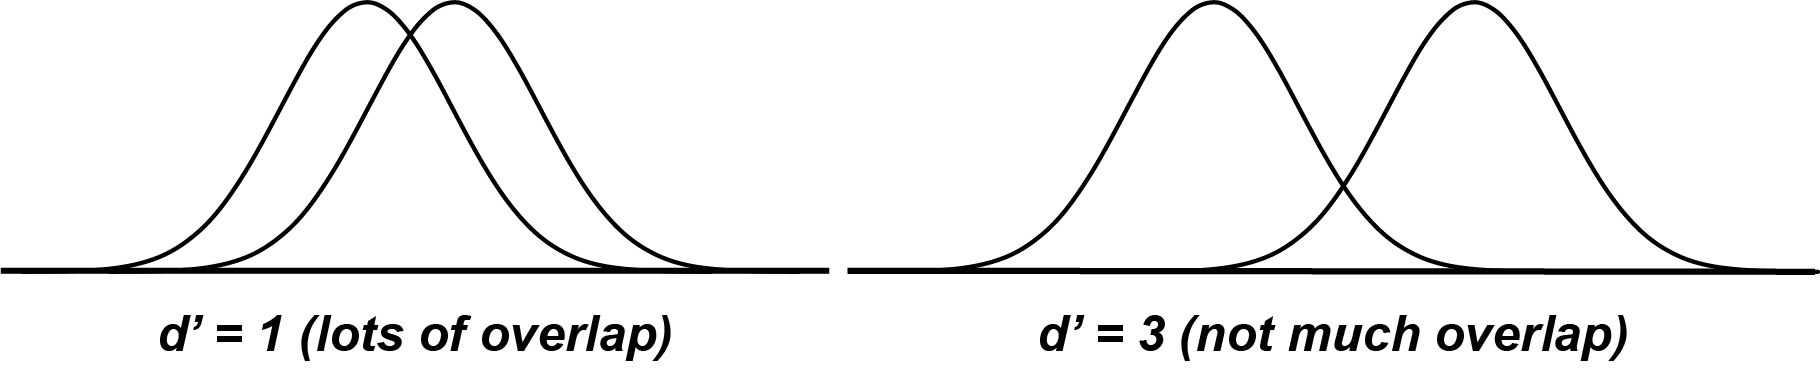
The following are true given the above situation: “hits” are trials that fall under the signal distribution and are correctly labled “signal”; “misses” are trials that fall under the signal distribution and are incorrectly labeled “noise”; “correct rejections” are trials under the noise distribution that are correctly labeled “noise”; and “false alarms” are trials under the noise distribution that are incorrectly labeled “signal”. $d\prime$ is a measure of sensitivity, given by the distance between the means of the two distributions. $d\prime = z_{\text{hit}} - z_{\text{false alarm}}$, where $z$ is the deviation of the criterion from the mean, given in standard units ($z$-scores). Since $d\prime$ is a measurement of how far apart the two distributions are, a higher $d\prime$ means that signal trials and noise trials are very clearly separated; thus, higher $d\prime$ signifies better performance.
(Image by James Cheung. Adapted from: Heeger, 2003)
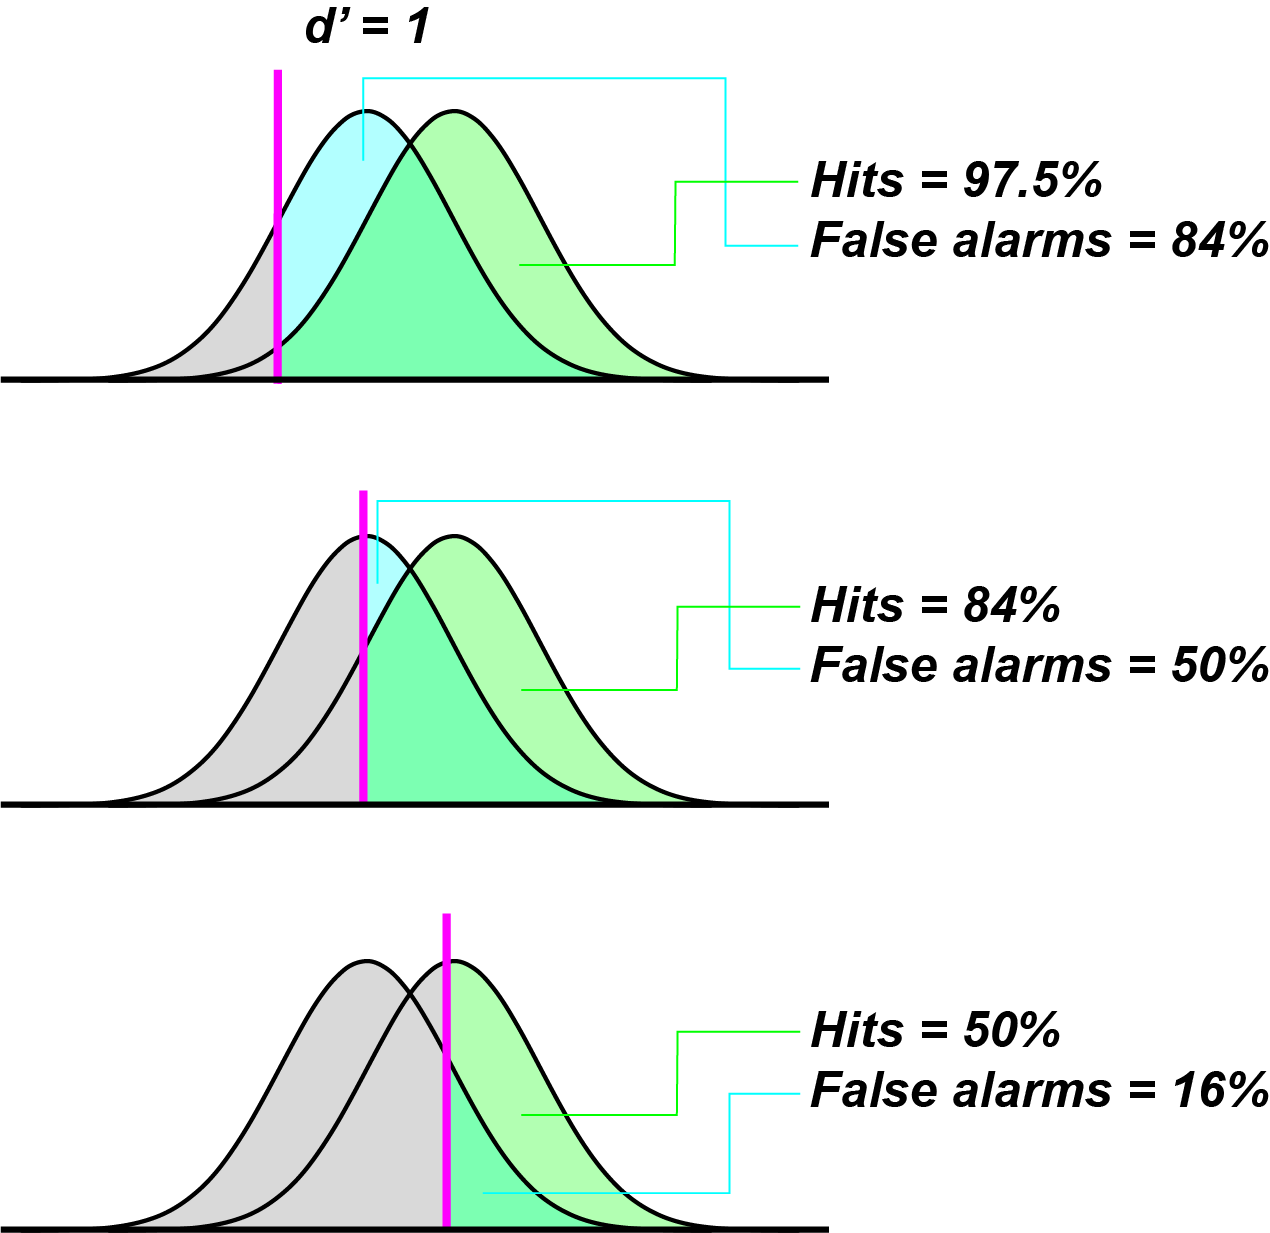
Criterion adoption (i.e. how liberal you are at labelling a trial as “signal”) does not affect sensitivity as measured by $d\prime$.
(Image by James Cheung. Adapted from: Heeger, 2003)
$d\prime$ scores - the higher the $d\prime$, the more discriminable the two types of trials are; thus, the better the performance.
In addition to Signal Detection Theory, modern psychophysics and psychacoustics also makes use of the staircase method. Staircase methods are used to find a stable perceptual threshold of discriminability given a unidimensionally varying object. Staircase methods are self-adjusting trials of same-different judgments, where stimuli presented in each trial are selected so as to converge upon some criterion of performance. For example, the two-up-one-down method converges to a threshold of 75% correct performance. (Wickens, 2001)
Loudness Perception
Very often, we need to know how loud a sound is; although this seems like a very simple question, it proves to be more complex than one might think. Let’s begin by defining some of the more common units used in the literature to describe the loudness of a sound.
Intensity
The intensity of a sound is proportional to the square of the amplitude and is measured in watts per meter squared
\begin{equation} I=\frac{P}{A} \label{eq:Intensity-formula} \end{equation}
where $I$ is intensity ($\mathrm{W/m^2}$), $P$ is power in watts, and $A$ is area in square meters.
Decibels
The bel is a unit of measurement created by Bell Laboratories to quantify the reduction in audio level that a signal underwent as it travelled over a mile length of telephone cable. The bel (B) is named after Alexander Graham Bell and the decibel (dB—note the B is capitalized because it refers to Bell’s last name) is simply 1/10th of a bel. The decibel is defined as
\begin{equation} dB=20log_{10}(\frac{A}{A_0}) \label{eq:dB-amplitude} \end{equation}
for amplitude, where $A_0$ is some reference amplitude, and
\begin{equation} dB=10log_{10}(\frac{I}{I_0}) \label{eq:dB-intensity} \end{equation}
for intensity. As we an see from these equations, the decibel is not an absolute measure, but rather a comparison against a reference. In acoustics, the measure dB (SPL—Sound Pressure Level) is often used which indicates that the reference is $10^{-9}$ of atmospheric pressure, $2\times 10^{-5} \mathrm{N/m^2}$ at 1000Hz, or $10^{-12}$ watts for power. Although this may seem complicated, the decibel is really a convenient measure of loudness since our ears work on something closer to a logarithmic scale. See figure for a common sounds and their dB levels.
|
dB(SPL) |
Source (with distance) |
|
194 |
Theoretical limit for a sound wave at 1 atmosphere environmental pressure |
|
180 |
Rocket engine at 30 m; Krakatoa explosion at 100 miles (160 km) in air |
|
150 |
Jet engine at 30 m |
|
140 |
Rifle being fired at 1 m |
|
120 |
Threshold of pain; train horn at 10 m |
|
110 |
Accelerating motorcycle at 5 m; chainsaw at 1 m |
|
100 |
Jackhammer at 2 m; inside disco |
|
90 |
Loud factory, heavy truck at 1 m |
|
80 |
Vacuum cleaner at 1 m, curbside of busy street |
|
70 |
Busy traffic at 5 m |
|
60 |
Office or restaurant inside |
|
50 |
Quiet restaurant inside |
|
40 |
Residential area at night |
|
30 |
Theatre, no talking |
|
10 |
Human breathing at 3 m |
|
0 |
Threshold of human hearing (with healthy ears); sound of a mosquito flying 3 m away |
Loudness And Frequency
Although much information about the nature of sounds can be gleaned by studying their amplitudes, intensities, etc. this information does not always tell us the whole story about how loud we will perceive a sound to be. Listen to the following two tones, the first at 100Hz and the second at 2000Hz. Although they both have the same amplitude, does one of them seem louder?
In 1933, H. Fletcher and W. A. Munson published a paper entitled “Loudness, it’s definition, measurement and calculation” in the Journal of the Acoustical Society of America in which they determined that the perceived loudness of a tone was in part determined by it’s frequency. Figure 1 is a plot of the equal-loudness contours or the Fletcher-Munson curves.
Figure 1: Fletcher-Munson curves for equal-loudness.
Each curve in this graph represents equal loudness, so if we look at the bottom curve, we can see that a tone at 100 Hz and a sound pressure level of approximately 27 dB(SPL) is equal to a tone with a frequency of 2000 Hz at approximately 0 dB(SPL) (see figure 2).
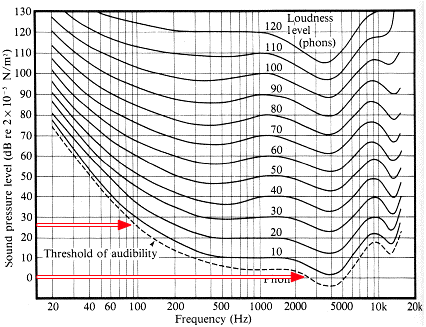
Figure 2: The two points indicated on by the red arrows will be perceived with equal loudness.
In general, we can see from the graph that the area around 2000-3000 Hz is the loudest—this tells us that our auditory system is the most sensitive to frequencies in this range. As we will see below, this is a top-down view of sound, i.e. there is nothing physically different about tones with the same amplitudes and with frequencies at 100 and 2000 Hz, but we perceive them differently due to the nature of our auditory system. Note that the loudness levels are in phones (see below).
Phones
A phon is a subjective measure of equal loudness relative to a 1000 Hz sine tone. For example, if we have a single sine tone at 1000 Hz and 30 dB(SPL) and another tone at 100 Hz, we adjust the 100 Hz tone until it is as loud as the first tone. We would then say that the 100 Hz tone has a loudness level of 30 phons, or put another way, 30 phons means that a tone is as loud as a 1000 Hz tone at 30 dB(SPL).
Sones
One sone is equal to 40 phones (i.e. the loudness level of a 1000 Hz sine tone at 40 dB(SPL)). To say it another way, the loudness level of a tone at 40 phones is one sone. We can calculate the loudness of a tone in sones using Stephens’ power law:
\begin{equation} \Psi=kI^p \label{eq:Stephens-power-law} \end{equation}
where $\Psi$ is the measure of loudness of a single tone, $I$ is the intensity ($\mathrm{W/m^2}$—see above), and $k$ and $p$ are constants. The value if $k$ is $1/15.849$ and the current international standard for $p$ is $0.3$.
Loudness Of Multiple Pitches
If we hear two tones simultaneously that are separated in frequency by more than a critical band (We will discuss the critical band in detail in the next unit. For now, a good rule of thumb is that the critical band is approximately 1/3 of an octave.), the resulting loudness will be approximately equal to the sum of the loudness of each component. If, however, the two tones are within a critical band, the loudness can be approximated by applying Stephens’ power law to the intensity of the sum of the loudnesses. Note that because the power in Stephens’ power law is less than 1, the loudness of two closely spaced tones will be less than that of two tones well separated in frequency assuming equal amplitudes for all of the freqencies.
Loudness And Spectra
As we have seen, loudness is not an absolute phenomenon, but rather our perception of loudness can be influenced by our auditory system. In addition to frequency, another factor that influences loudness is spectral content. In the following example, you will hear two sounds: the first one is a pure tone (sine tone), and the second is a complex tone (harmonic). Although their waveforms show that they both have the same amplitude, which one sounds louder?
The signal with multiple harmonics sounds louder than the pure tone because our auditory system integrates across frequency (Remember integration from calculus? If not, see the side bar.) so although the pure and complex tones have the same amplitude in the time-domain, the area under the curve is much greater for the complex tone in the frequency-domain.
The spectral integration that our ear performs is an important feature of the way in which we perceive many orchestral instruments, especially the brass instruments. Figure 3 is a sonogram of a tuba playing an A3 starting moderately loud (mf), getting quieter, and then getting louder. Notice that the fundamental (the lowest line in the sonogram) doesn’t change amplitude much, but rather, the change in volume comes from the addition of upper partials.
Loudness And Time
In addition to the spectral integration we just discussed, the ear also performs a kind of temporal integration. If we hear a very short sound, say 50 ms long, and then hear the same sound for a longer duration, say 200 ms, the latter will appear to be louder even though they both have the same amplitude. Although this effect works well for sounds less than around 250 ms, due to reasons we will discuss in a later unit, the effect is not apparent for sounds longer than around 250 ms.
|
| |
|
| |
Loudness Cues
If someone very far away screams, most listeners will judge the scream a being loud, even though the sound that arrived at the listener had a low amplitude. As we saw with the tuba example above, the timbre of a sound can also give us some cues about the nature of the signal. As the tuba got louder, it also got brighter and if it were very far away, we would still be able to tell that the performer was playing forte instead of piano. The same is true with the human voice—a scream is not just louder than speaking voice, but it has a different spectral content. Given this, when we hear a sound, we can not only tell something about the origin of it (if the person was speaking or screaming, or how loudly the tubist was playing), but we can infer something about the distance of the sound.
Listen to the following examples; in the first example, you will hear someone speaking at a normal volume and in the second, you will hear a scream. Although the spoken voice is much quieter than the scream, we are still able to tell that one is louder than the other.
|
| |
(Audio source: The Big Lebowski)
|
| |
An interesting experiment was carried out at the Center for New Music and Audio Technologies (CNMAT) at UC Berkeley. Two speakers were set up as in figure 5—one farther away from the listeners than the other. On top of each speaker was a light and a third speaker was hidden from the listeners. The listeners were asked to write down which speaker the sounds came from; although the sounds all came from the hidden speaker, the lights of the other two speakers would turn on giving the listeners the impression that the speaker with the light on had made the sound. In this case, although all of the sounds that the listeners heard were the same and originated from the same source, the listeners were fooled by the visual information they were receiving. This illustrates the strength that the visual system can have over the auditory system in the way that we perceive the world around us.
Reverb and Room Acoustics
Reverberation Introduction
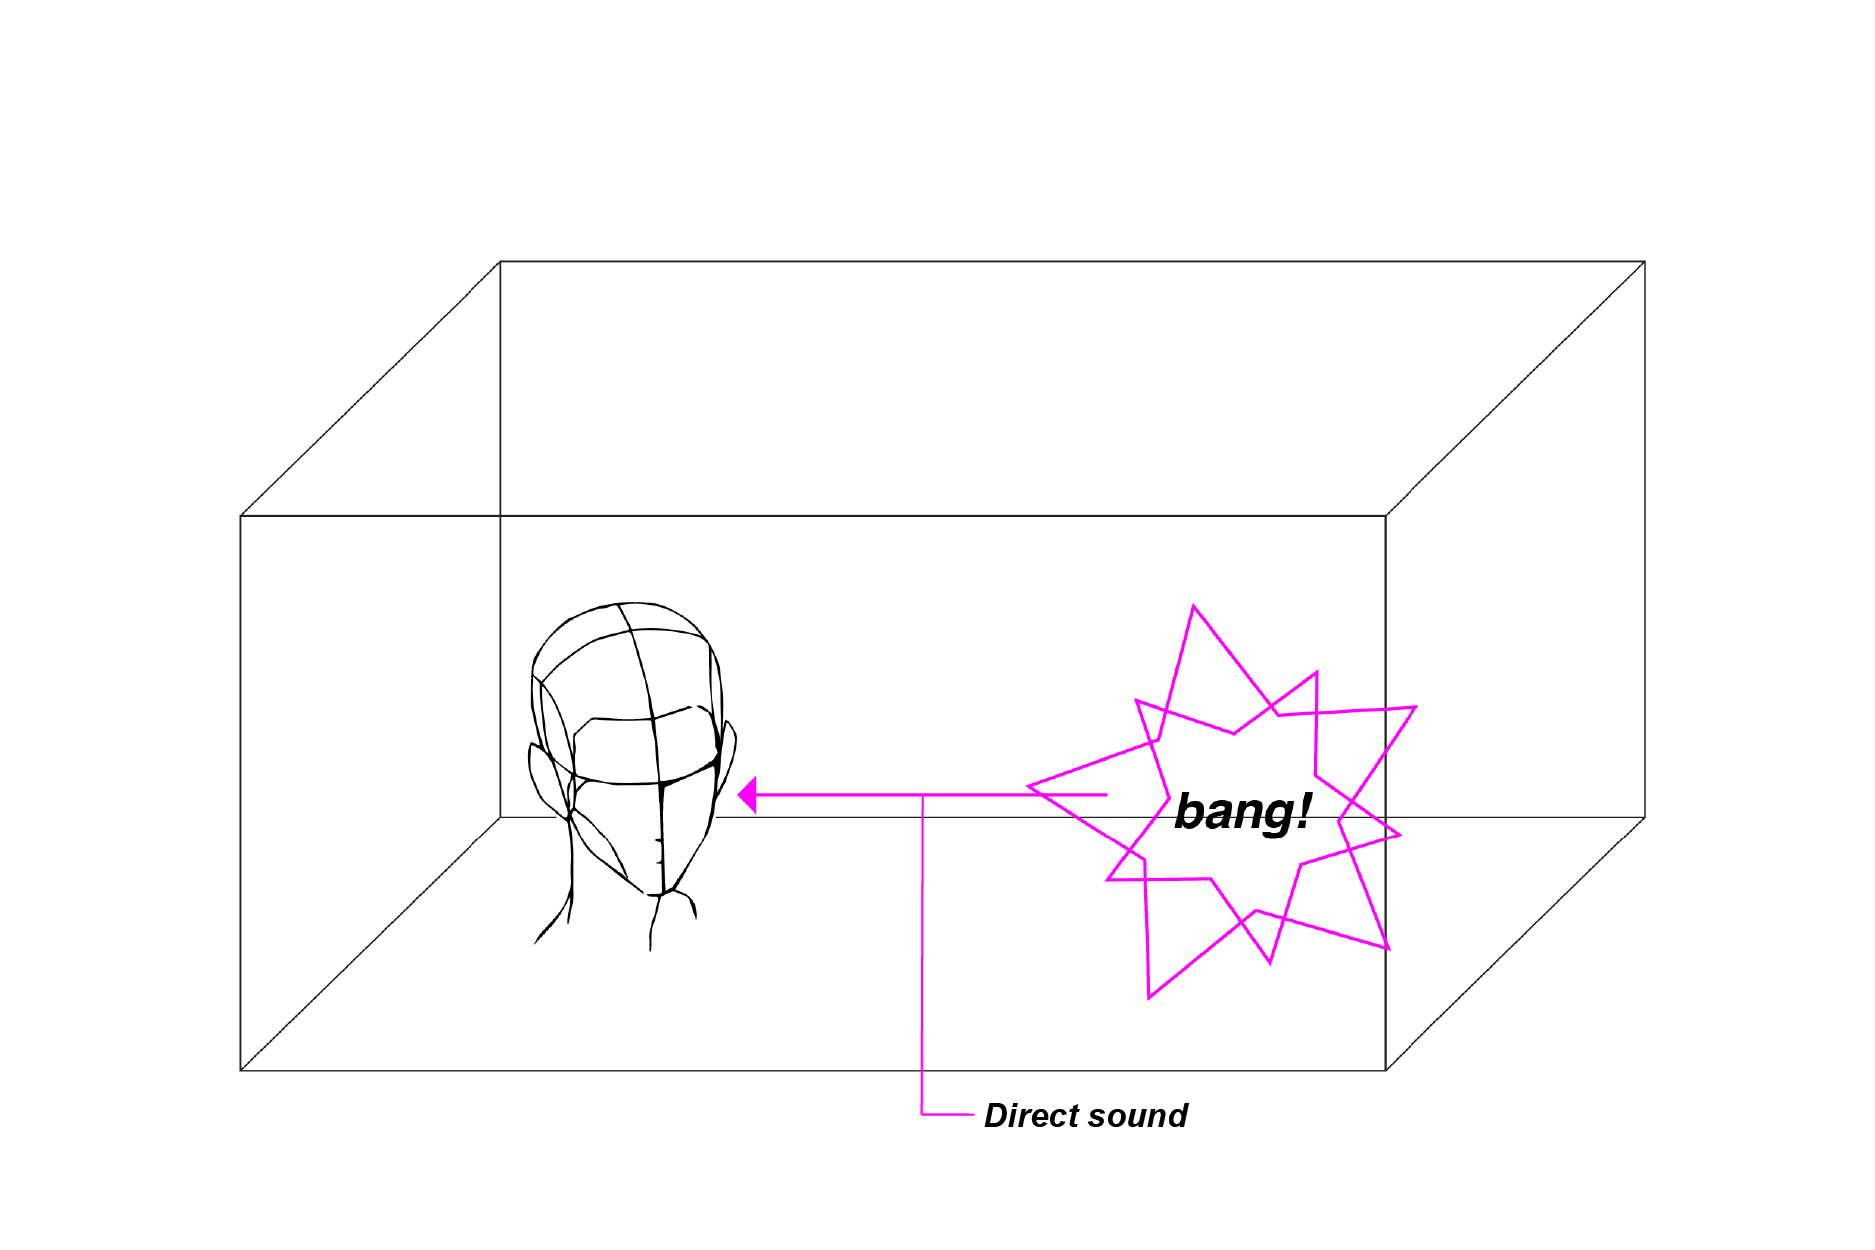
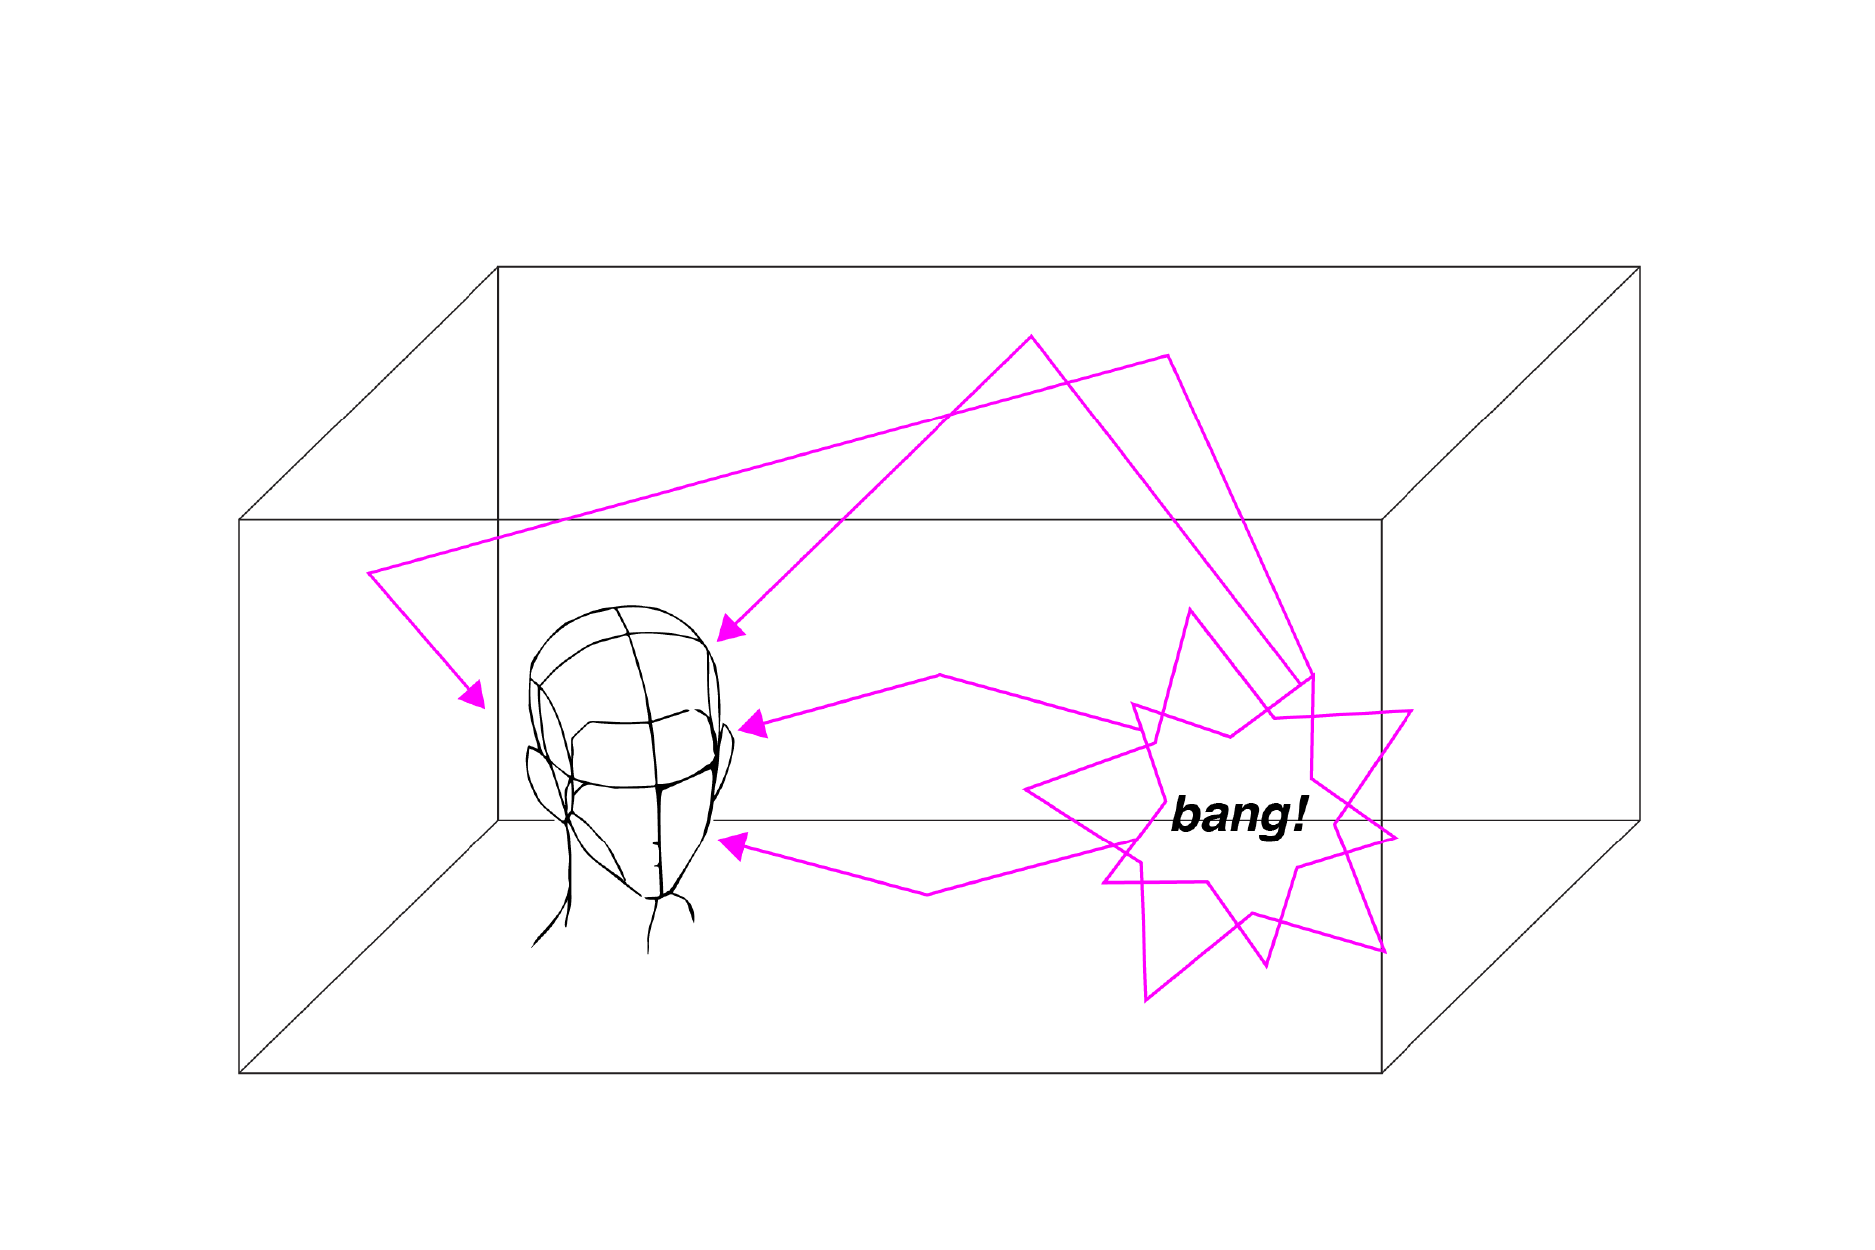
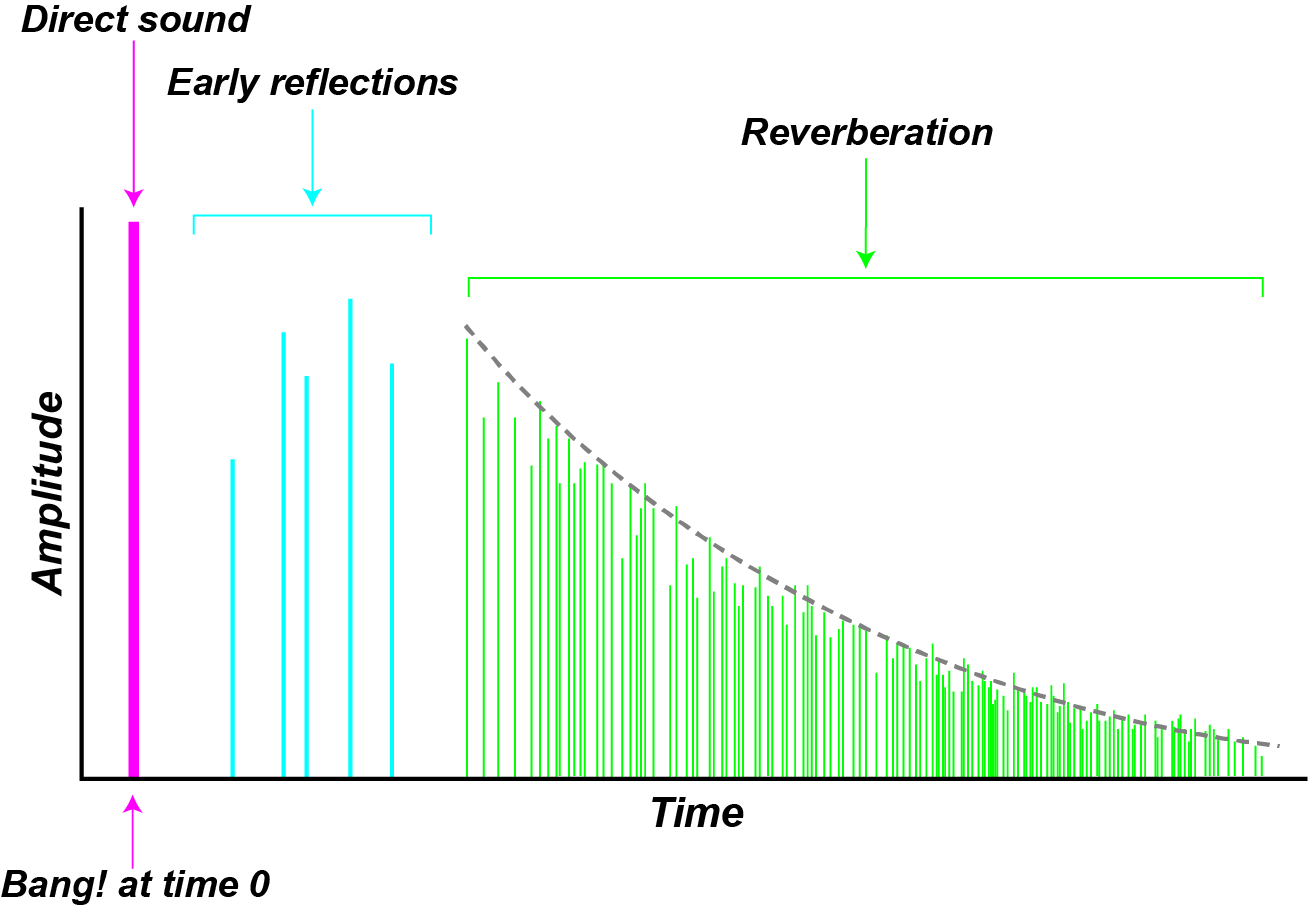
Reverberation (or reverb) is the result of sounds reflecting off of the surfaces of an enclosed space. Imagine that we make a loud noise (by firing a starter’s pistol or poping a balloon) in a cathedral or a hall. The first sound that a listener would hear is called the direct sound (figures -).
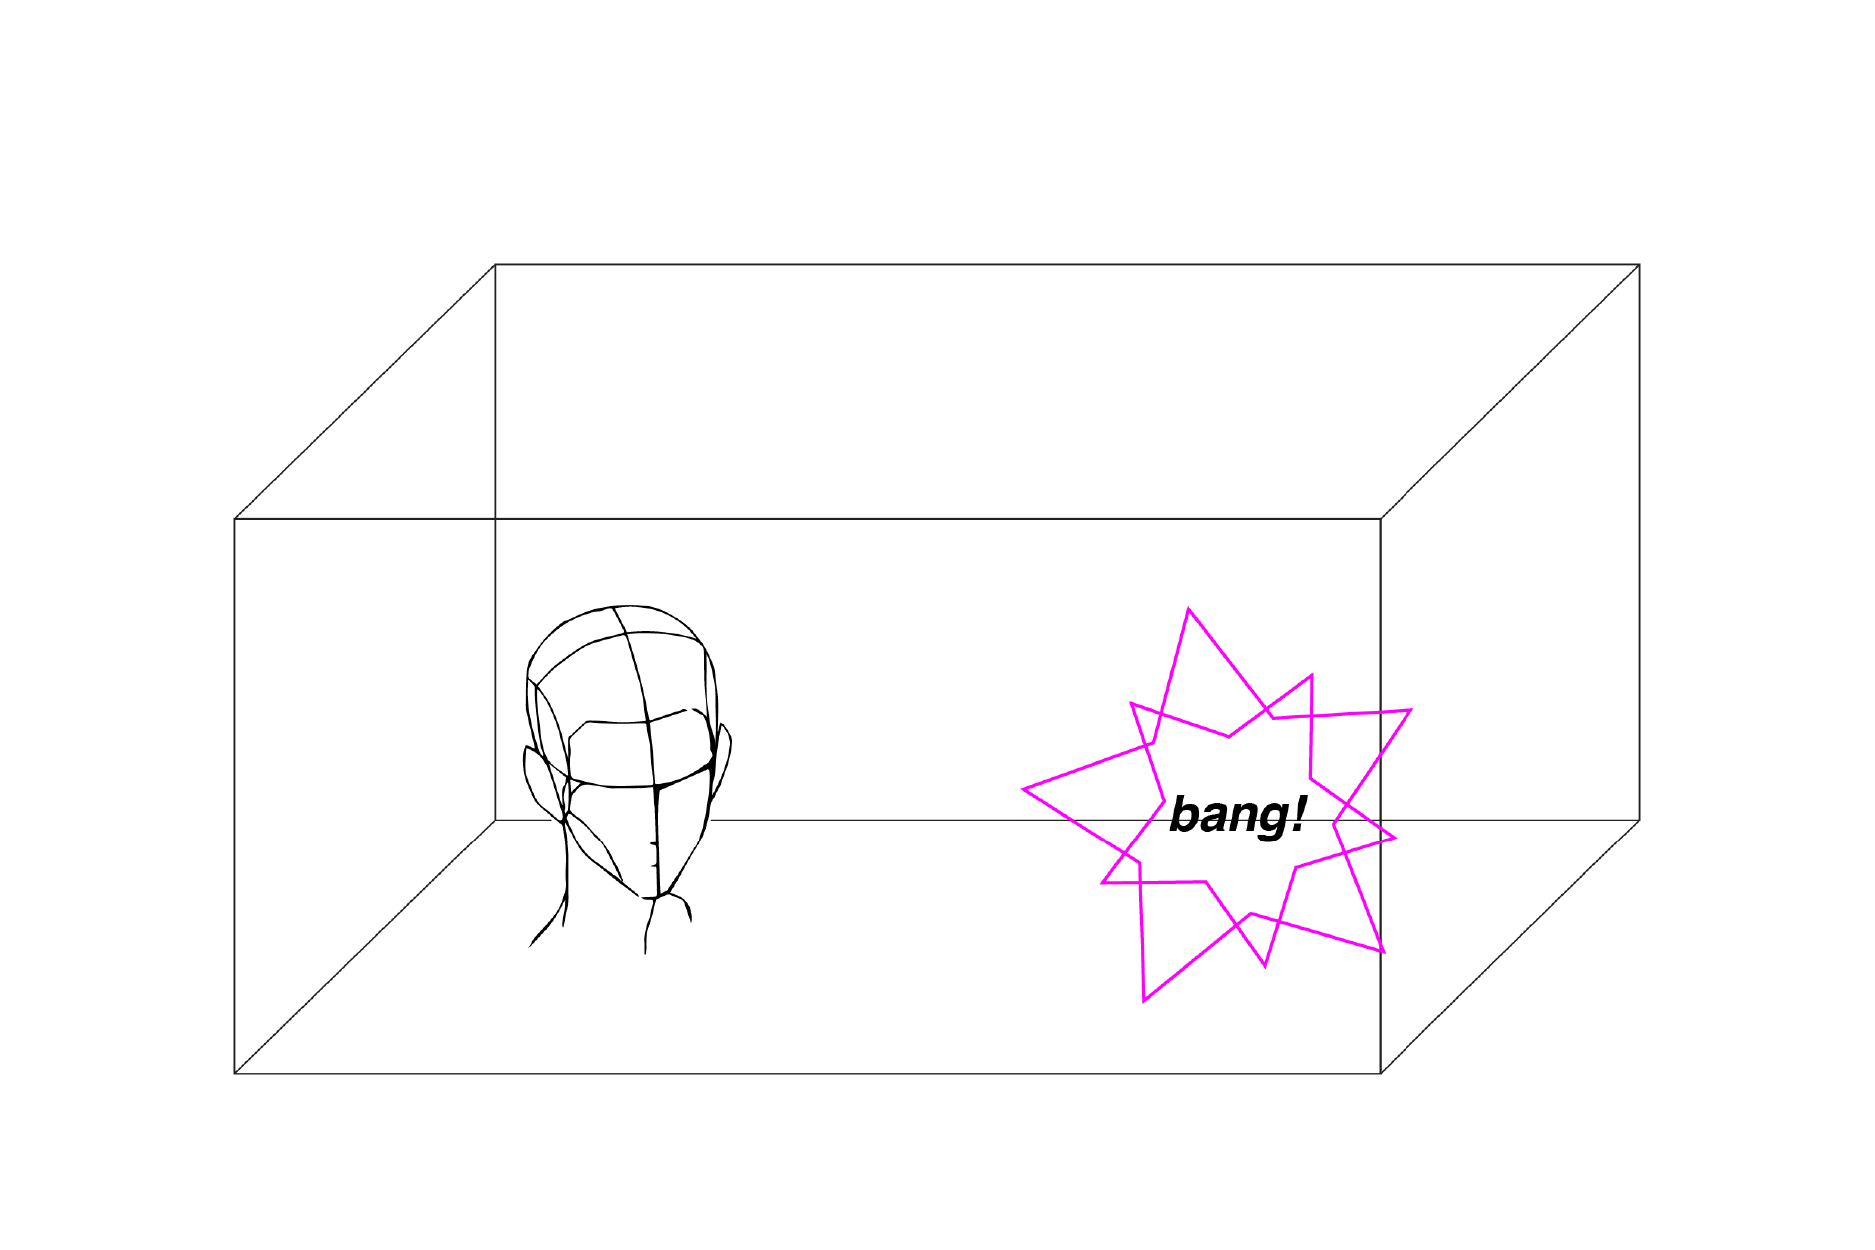
(Image by Janina Luckow. Adapted from: (Howard et al., 1996))
(Image by Janina Luckow. Adapted from: (Howard et al., 1996))
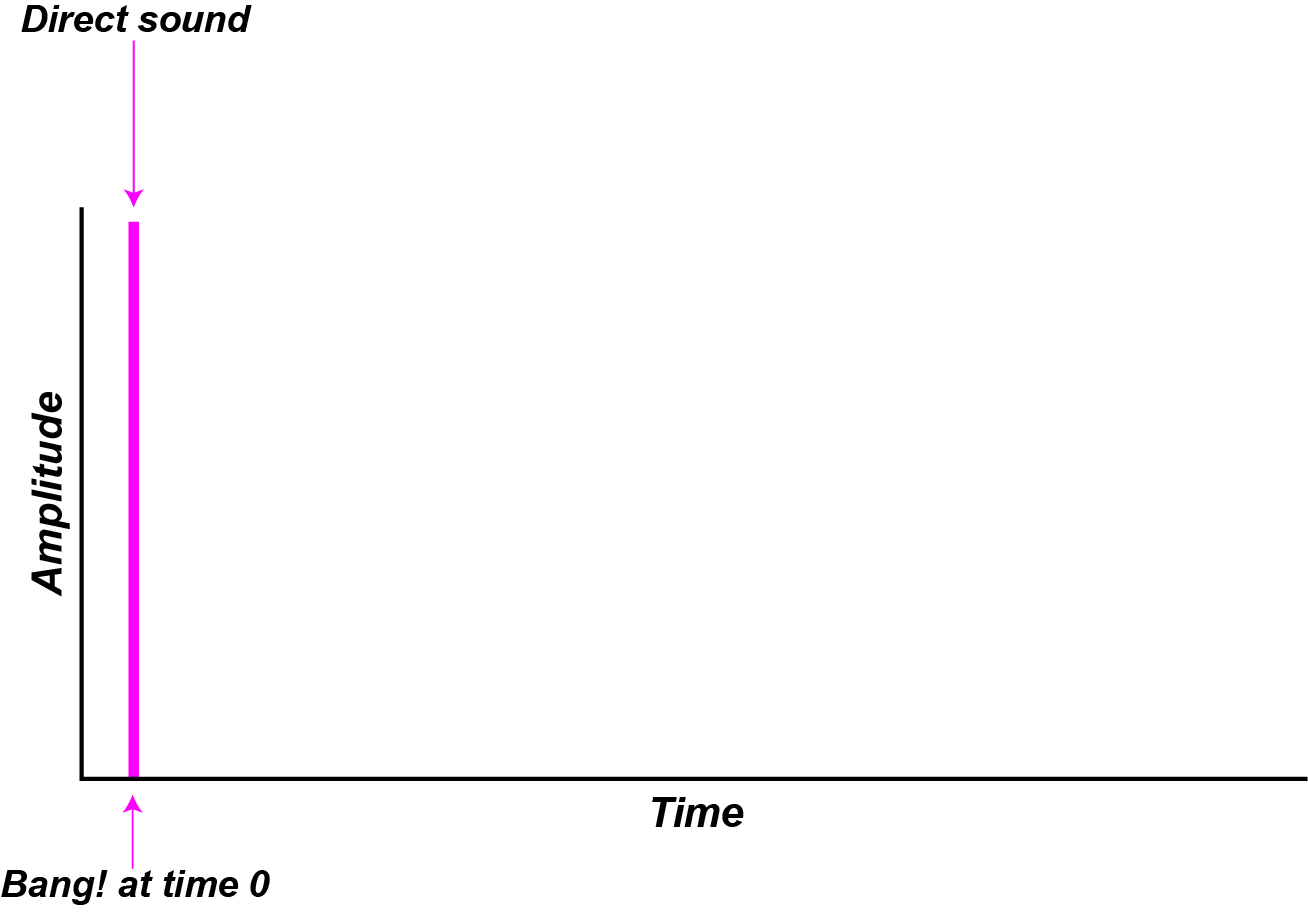
(Image by James Cheung. Adapted from: (Howard et al., 1996))
The direct sound is followed by a number of early reflections that arive at the listener after some delay and loss of energy (figures -). The length of the delay and the amount of energy lost are dependant on the size of the room and the type of material used to make the surfaces (the walls, floor, and ceiling).
(Image by Janina Luckow. Adapted from: (Howard et al., 1996))
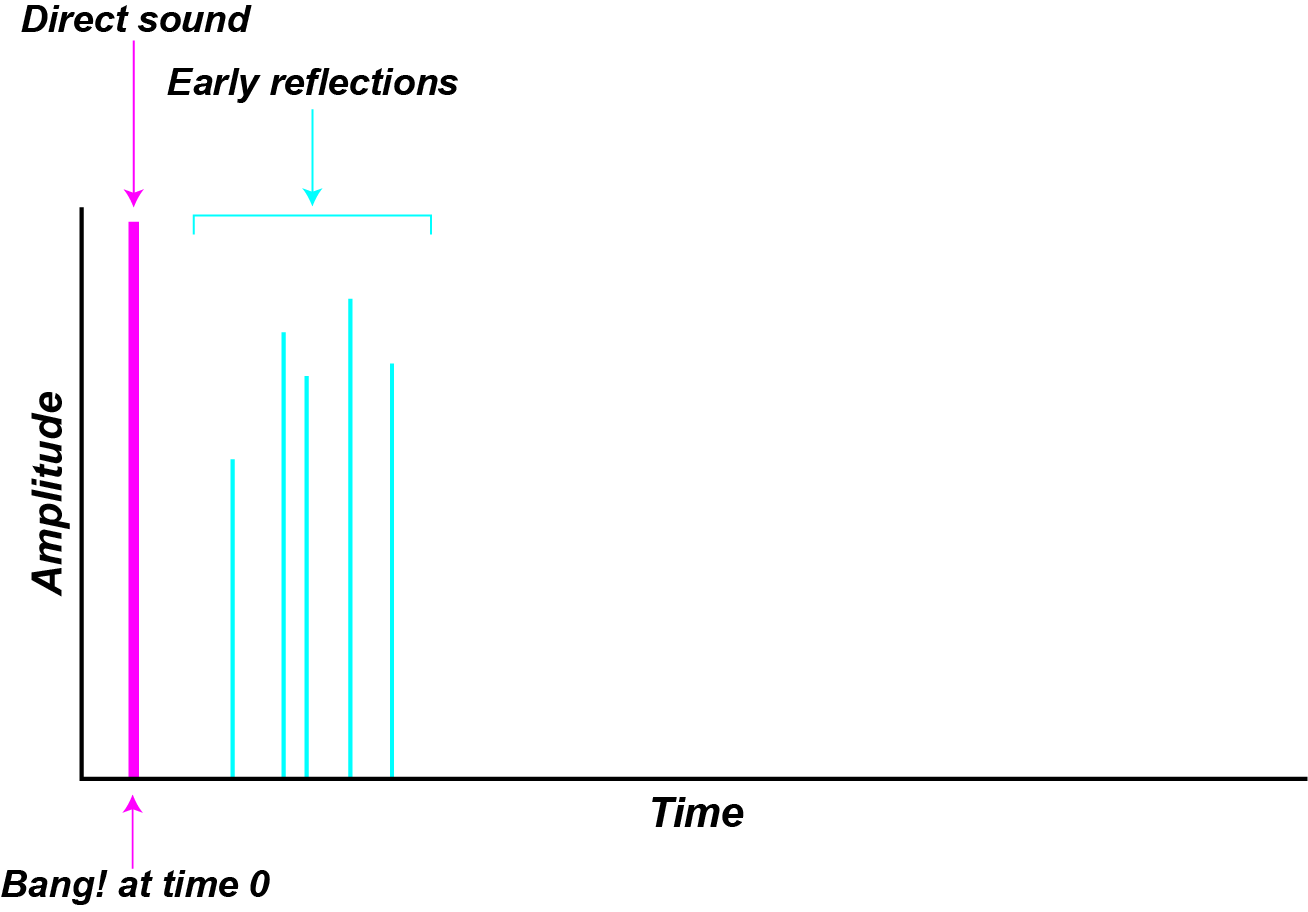
(Image by James Cheung. Adapted from: (Howard et al., 1996))
As these early reflections continue to bounce off the surfaces they begin to pile up and overlap creating reverb (figures -).
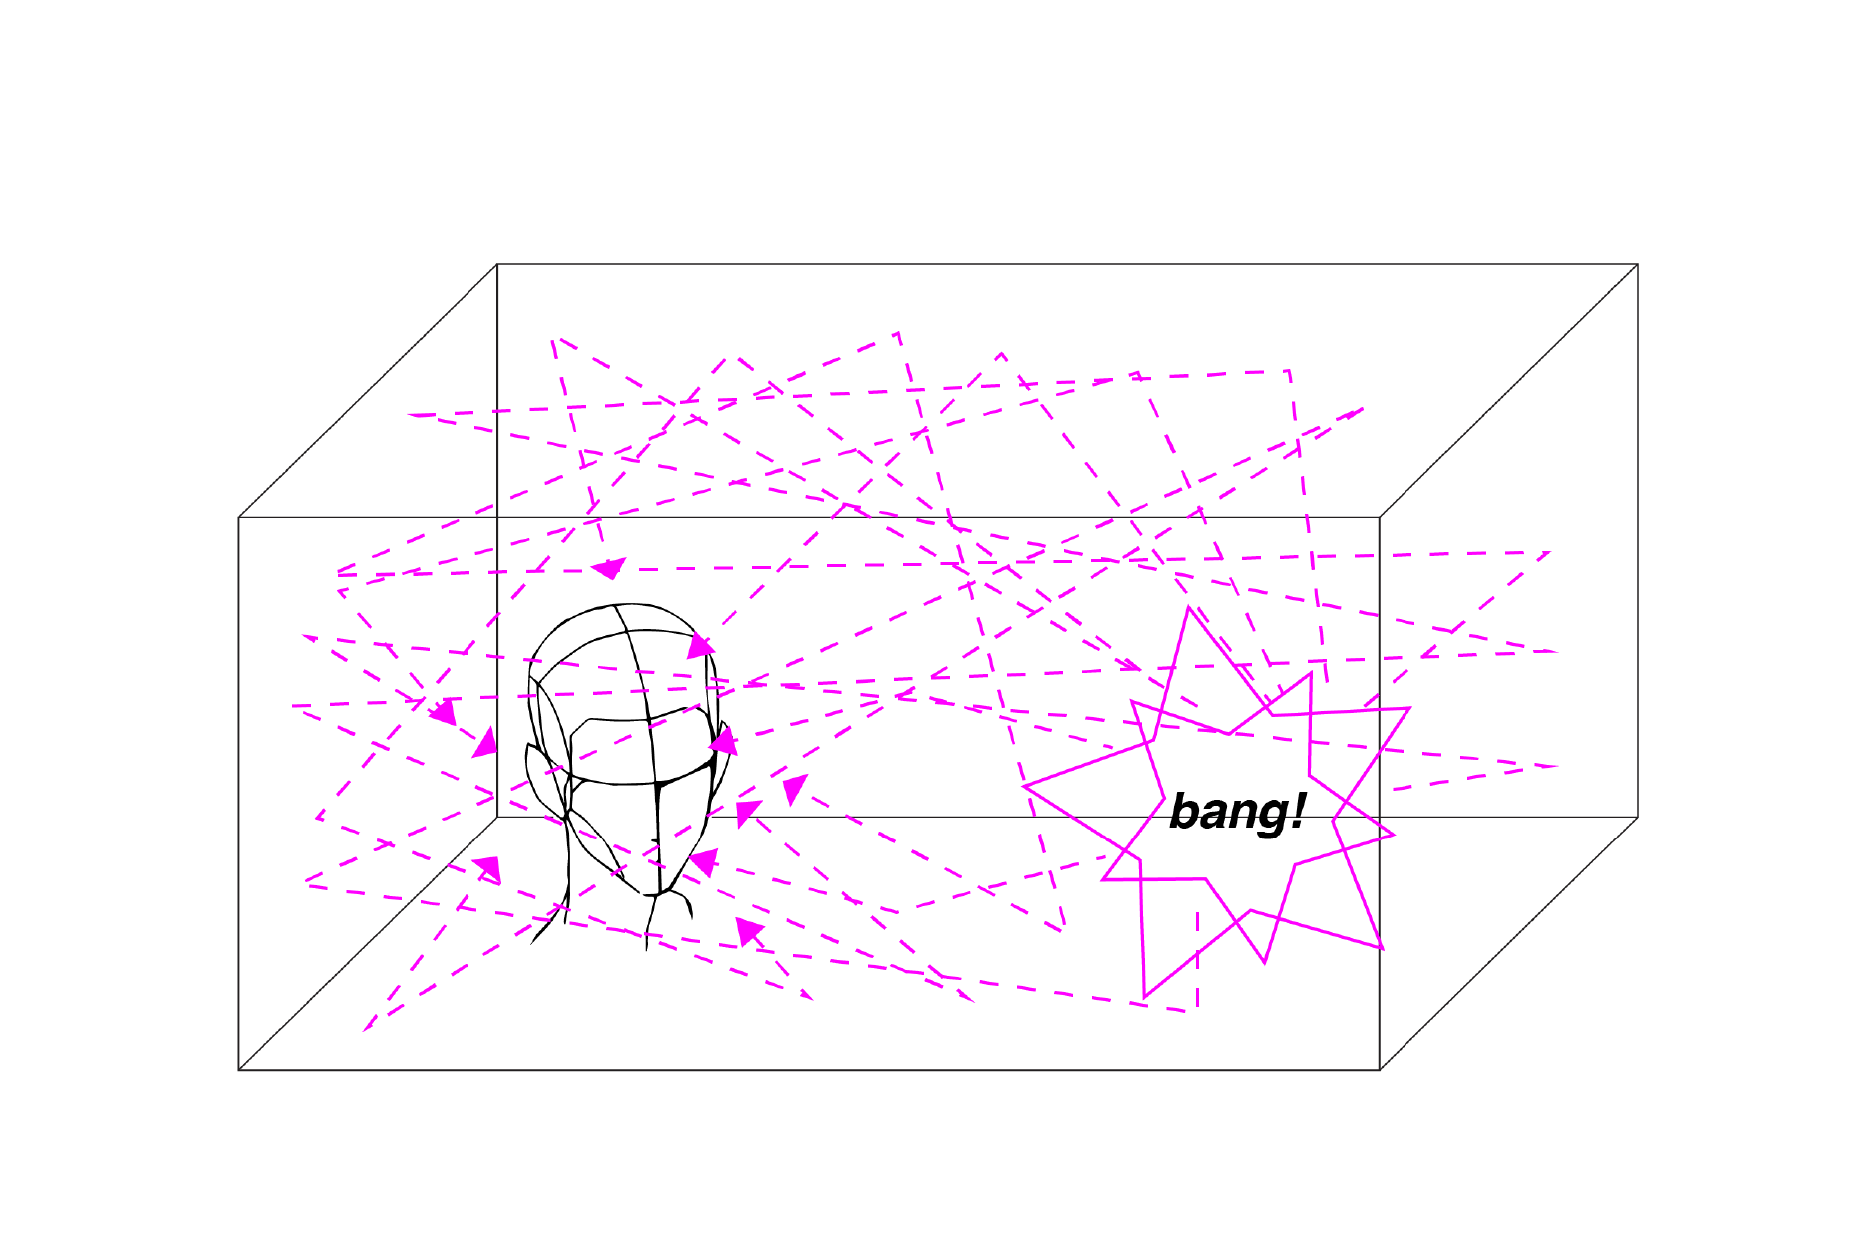
(Image by Janina Luckow. Adapted from: (Howard et al., 1996))
(Image by James Cheung. Adapted from: (Howard et al., 1996))
A More Indepth Look At Reverb
A More In-Depth Look at Reverberation
Our perception of a sound is influenced in many ways by the distance it must travel to reach our ears. Since sound travels at 344 meters per second (1129 feet per second), the time it takes for a sound to travel from source to listener can be calculated by
\begin{equation} d=\frac{r}{344\mathrm{m/s}} \label{eq:delay-formula} \end{equation}
where $d$ is the delay time in seconds and $r$ is the distance in meters. This delay from source to listener has important consequences for sound amplification—see the section on the precedence effect.
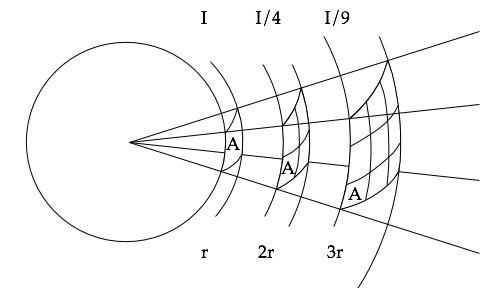
The intensity of the direct sound as experienced by a listener decreases with distance and can be calculated by
\begin{equation} I=\frac{P}{4\pi r^2} \label{eq:inverse-square} \end{equation}
where $P$ is the initial power of the signal, $r$ is the distance from the source in meters, and $I$ is the intensity in $\mathrm{W/m^2}$. Notice that the denominator in the above equation is the area of a sphere due to the fact that sound radiates out in all directions in a spherical pattern. As sound continues to propagate away from the source, it diffuses over a larger and larger area (figure 3.21). Imagine that you are standing one meter away from a sound source and the intensity of the sound when it reaches you is 100 dB. If you move 10 meters away from the source, the sound will be spread over 100 times the area and the resulting intensity will be 1/100 of the original or 80 dB.
The later reflections also depend on the absorptive quality of the surfaces they bounce off of and can be calculated by
\begin{equation} Ir = \alpha I \label{eq:sound-absorption} \end{equation}
where $Ir$ is the intensity after reflection, $I$ is the intensity before reflection, and $\alpha$ is an absorption coefficient.
Finally, it can be useful to know what the reverb time in a hall is, i.e. how long does it take for the reverb to die away after a sound is made, but first we must define reverberation time. The reverb time of an enclosed space is the time it takes for the amplitude of a signal to decrease by 60 dB. This number was chosen because a typical symphony orchestra at their loudest is around 100 dB and the background noise in a quiet room is around 40 dB. Knowing that, we can calculate reverb time using WC Sabine’s formula:
\begin{equation} RT_{60}=C\frac{V}{A} \label{eq:reverb-time} \end{equation}
where $RT_{60}$ is the reverb time, $V$ is the volume of the enclosure, $A$ is the sum of the absorption coefficients for each surface, and $C$ is a constant that takes on 0.161 for calculations in meters and 0.049 for feet.
Sound examples — are impulse responses of three different halls and their sonograms. Notice that the reverb of each hall decays in a different way and that different frequency regions decay quicker than others but that in general the low frequencies remain active longer than the high frequencies—this is a typical property of the reverb of most enclosed spaces. Also, note that the early reflections can be heard clearly in the second and third examples.
(Audio source: CKSDE. Licensed by copyright owner)
(Audio source: CKSDE. Licensed by copyright owner)
(Audio source: CKSDE. Licensed by copyright owner)
Top-Down
While Bottom-Up perspectives of perception refer to the stimulus-driven processing of sounds beginning from the periphery of the auditory system, Top-Down perspectives begin with the higher-level mental processes that are accessible to the human mind. Top-Down processes may include our knowledge of the context of a piece of music, our memory of related musical pieces, the cognitive effort of paying attention to certain aspects of the stimulus, and our emotional state during the perception of music.
One example of top-down knowledge is the understanding of a musical allusion - i.e. knowing the source material from which another musical work is quoting. This can often influence how the music is perceived. A famous case of a musical allusion is in the third movement of Mahler’s First Symphony.
Children’s song “Frère Jacques”
|
| |
The opening measures of Mahler’s Symphony No. 1 in D, “Titan”, 3rd movement.
|
| |
(Audio source: Reinhold Behringer, Wikimedia Commons)
Mahler quoted the melody from the traditional children’s song Frère Jacques, but transposed it into the minor mode. An especially eerie and intriguing effect is achieved when the audience recognizes the source of the musical quotation. Thus the perception of the mood of this piece is enhanced by top-down knowledge.
Another example is the effects of visual information on the perception of musical sounds. In an audiovisual environment, information received by the visual and auditory systems interact in important ways. The use of sound effects and soundtracks in the film industry relies heavily on AudioVisualInteraction, and much research has shown that auditory, visual, and tactile sensations influence each other in perceptual as well as cognitive processing.
Perceptual Illusions
Top-Down perspectives influence Bottom-Up processing in many important ways. Compare the heights of the two people in the following picture.

(Image by John MacCallum)
Although the two persons are identical in actual size, the figure closer to the bottom of the picture is perceived as being smaller than the other person. This is because of top-down inference of the higher person being further away, and our knowledge of linear perspective playing a role in the picture leads us to infer that the further figure is larger. If the background context is removed, the illusion disappears and we perceive both people as of similar size.

(Image by John MacCallum)
Perceptual illusions like this one often rely on the unconscious inference of contextual cues, which is based on top-down knowledge of naturalistic scenes.
Melodic Processes
The effects of Top-Down processing are not limited to the perception of visual illusions. Top-Down, cognitively-driven processing of sounds is equally important in auditory perception. Psychoacoustical studies have shown that the perception of loudness depends on top-down factors. For example, shouting from afar is perceived as being louder than whispering from nearby, even if the absolute levels of the sound signals are the same. This is because the auditory system makes use of cues such as timbre, source location (which may include reverb), and any visual information available (see AudioVisualInteraction), in order to adjust the experience of the sound signal coming from Bottom-Up processes. The Top-Down modulation of Bottom-Up processing serves important evolutionary advantage, as some knowledge of the relative importance of sounds is necessary for the mind to effectively process and prioritze information so to ensure survival.
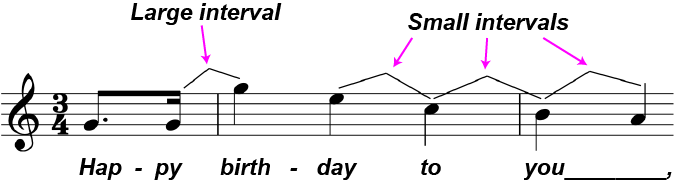
Top-Down influences also play important roles in the perception of more complex musical attributes. In his Implication-Realization model, Narmour (Narmour, 1990) laid out various principles of top-down influences on melodic perception, in which our top-down expectations for how melodies tend to sound may influence our experience of melodies. Narmour specifically discusses these top-down expectations in terms of intervals in a melody. Based on the general knowledge of perceptual organization, we tend to expect small intervals in one direction to follow large intervals in the opposite direction. The melodic process of large intervals being followed by smaller intervals in the opposite direction, also known as gap fill, is found in most popular tunes.
(Image by James Cheung)
A line from the Happy Birthday song, illustrating the principle of gap-fill. More on these top-down expectations for melodic processes will be discussed in Unit 9.
Precedence Effect
The Precedence Effect, also known as the Haas Effect or the Law of the First Wavefront, states that it is the first acoustic information that arrives at a listener that determines the location of a sound. When the same sound arrives at our ears from many directions, we tend to perceive the first sound wave that reaches us as the source, and the later wavefronts as reverberations, or echoes. The precedence effect can be demonstrated using stereo stereo speakers presenting pairs of click sounds. When two clicks are presented from opposite speakers within a very short time of each other, where the first click is called the “lead” and the second is the “lag”, we tend to perceive the sound source to be from the “lead”. The “lag” is perceived as an echo. If the location of the lead and lag are switched (i.e. the speaker that was playing the later click in the pair, now plays the first click), then the new location is perceived as a sound source. Thus, the first sound to reach the ears is always perceived as the location of the sound source.
The precedence effect may be due to top-down influences on the auditory system. As it is ecologically unlikely for two very similar sound sources to be coming from opposite directions, the second click (the “lag”) is perceived not as a new source of sound, but as an echo of the first click (the “lead”). The fact that echoes are not perceived as sound sources is known as echo suppression. (Clifton, 1987)
Applications of Precedence Effect
Audio engineers make use of the precedence effect in the design of concert halls. If the speakers are closer to the audience than the performer is, the audience would perceive sound from the loudspeakers rather than from the performer. To ensure that sound is perceived as coming from the performer, audio engineers often implement delay lines between the performer’s microphone and the speakers, such that first wavefront reaching the audience comes directly from the performer rather than the speaker. If sounds from the speakers reach the audience after sounds directly from the performer, then the perceived sound would be localized to the performer.
Franssen Effect
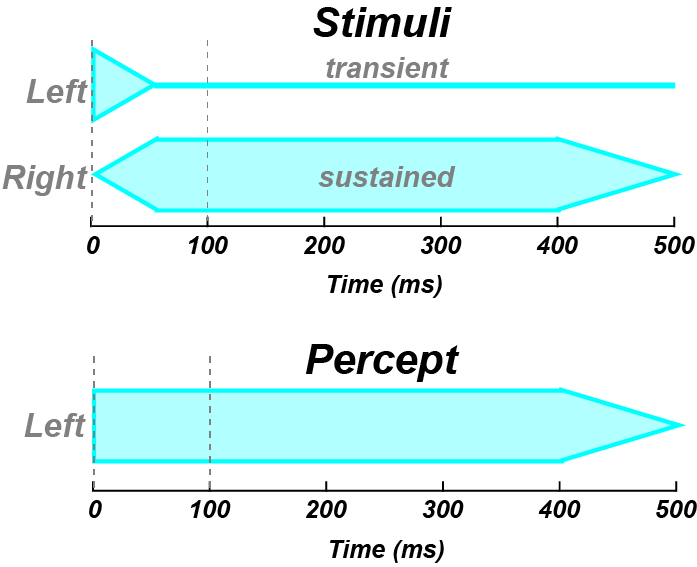
Like the PrecedenceEffect, the FranssenEffect has to do with perceived sound sources. In a two-channel speaker system, if a tone is presented with rapid onset to one speaker, and this tone is ramped off at the same time as when another tone in the opposite speaker is ramped on and sustained, this combination of tones is perceived as just one tone coming from the first speaker (i.e. the speaker that played the onset). The effect is obtained with narrow-band sounds, and only in echoic environments.
(Image by James Cheung. Adapted from: (Dent et al., 2004))
The Franssen Effect. If a rapid-onset tone is presented at the left speaker and then decays slowly while another tone at the right is presented with slowly increasing amplitude, the percept is of a single stimulus coming from the left.
Clifton Effect
The Clifton Effect is a change to the classical Precedence Demonstration. This change is described in the figure below. Again, pairs of clicks are presented with one slightly preceding the other (the first click is the “source”; the second is the “echo”.) Half way into the click train, the source and echo clicks are reversed. That is, halfway through the demonstration the loudspeaker that had delivered the first or source click now delivers the delayed or echo click and vice versa. In the Clifton Effect, an unexpected percept occurrs immediately after the switch, where two clicks are perceived often coming from the location of each loudspeaker. Then after 4 or 5 more click-pair presentations following the switch, a single click is again perceived and its location is now at the loudspeaker presenting the lead click, which is the opposite loudspeaker from that which produced the lead click for the first half of the click train. Most listeners tend to hear two clicks at the beginning of the click train, then fusion occurs, then after the switch two clicks are heard, and then finally fusion reoccurs but at the location of the other loudspeaker. That is, after the switch there is a temporary cessation or breakdown of the Precedence Effect; fusion and/or echo suppression stops. This breakdown occurred because of the prior exposure you had during the first half of the click train. Thus, your experience with the source and echo clicks somehow influenced your perception after the source and echo clicks were switched. Eventually however, echo suppression reoccurs and the Precedence Effect works as before. This demonstration suggests that echo processing might depend on our listening experience in the reflective spaces that we are currently in.
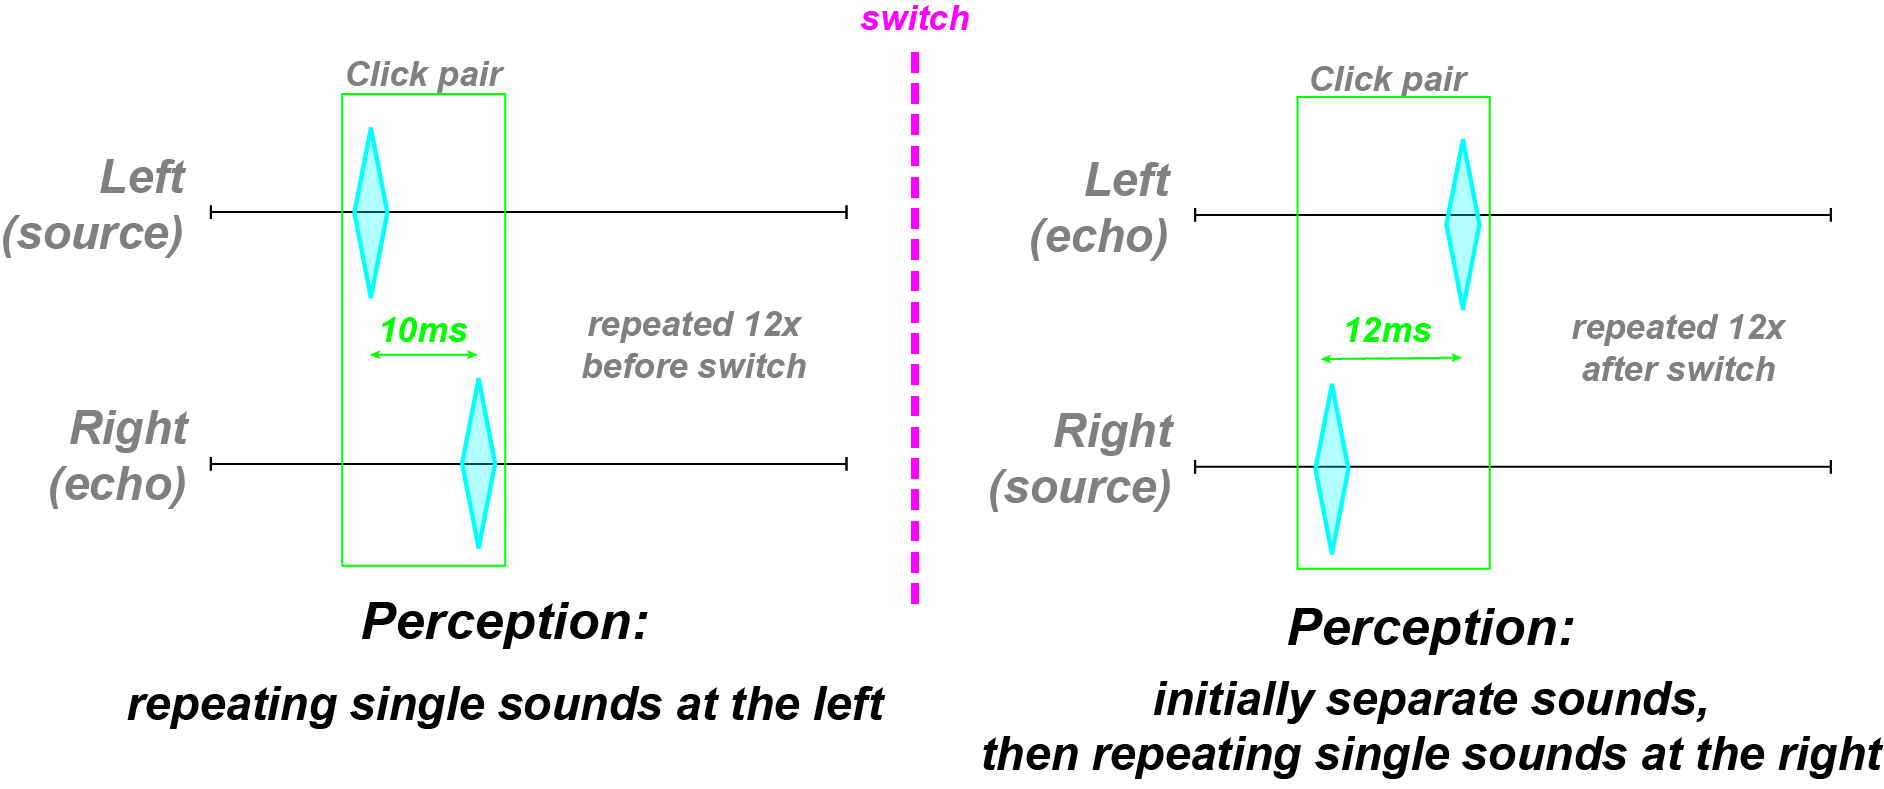
(Image by James Cheung. Adapted from: (Clifton, 1987))
In the Clifton demonstration the two clicks are always seperated by 12 ms and the click pairs are presented at a rate of about 3 per second.
|
| |
(Audio source: (Clifton, 1987))
Audio-visual Interaction
So far we have discussed the auditory system’s processing of sounds and its various dimensions, such as frequency and amplitude. We have also started to touch on the interactions between different auditory dimensions, such as the interaction between frequency and loudness as shown by the Fletcher-Munson curves. However, music is not just a series of auditory stimuli. Information from other modalities, such as vision and touch, also play important roles in the musical experience. What is seen can influence what is heard, and this is especially true from a Top-Down perspective.
Soundtracks in movies offer one case of auditory perception enhancing visual perception. The use of sound effects and soundtracks in the film industry relies heavily on AudioVisualInteraction, and much research has shown that auditory, visual, and tactile sensations influence each other in perceptual as well as cognitive processing. In one particular study by Marilyn Boltz (Boltz, 2001), video clips were paired with positive, neutral, and negative soundtracks and shown to study participants. After viewing the films, participants were asked to rate how well certain adjectives described the content of the video (e.g. “What adjective best describes the man’s intentions for following the womann? benevolent / malevolent”) Participants rated videos with positive soundtracks as being better described by positive adjectives, and videos with negative soundtracks using negative adjectives. Videos with no soundtracks were rated as relatively neutral. This study shows strong effects of musical stimuli on the perception of meaning and emotional content of visual scenes.
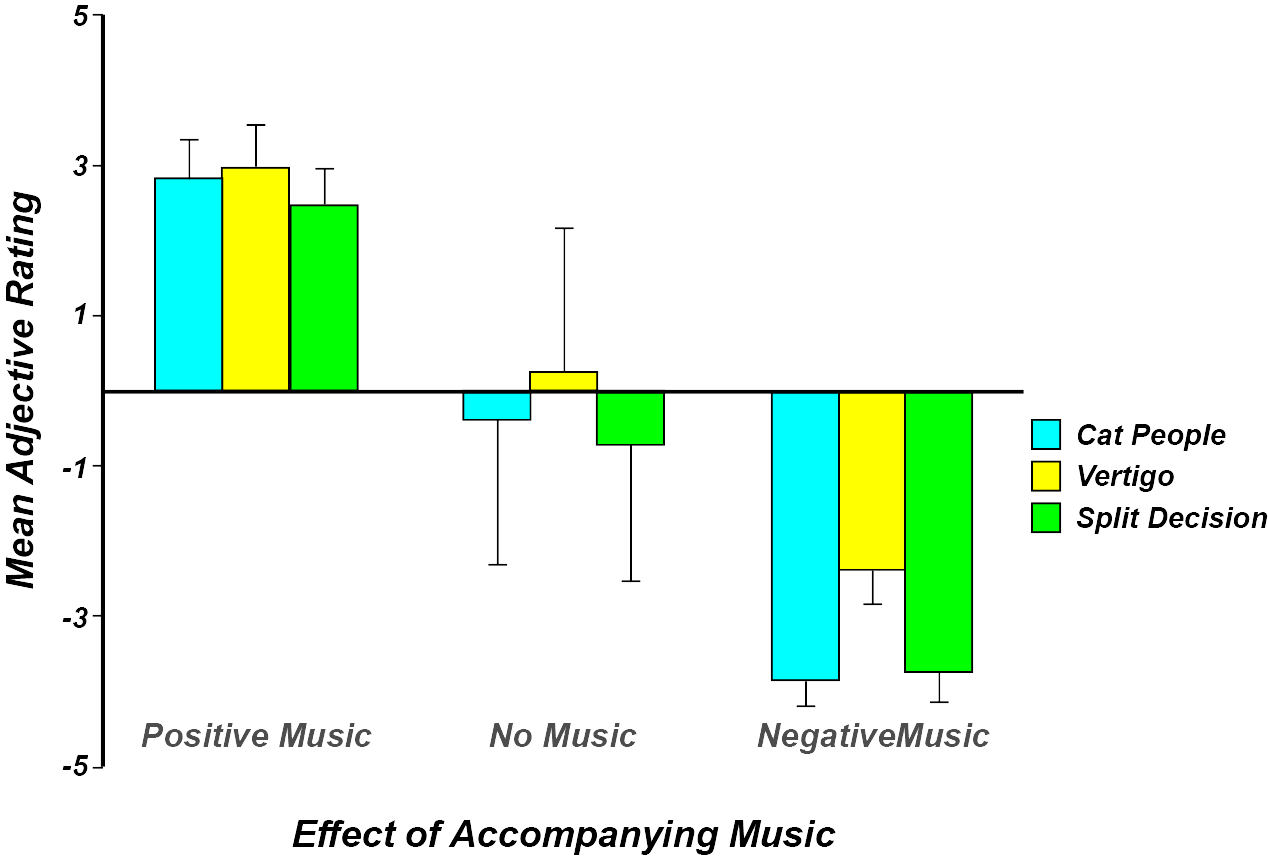
(Image by James Cheung. Adapted from: (Boltz, 2001))
In the real world, events in the visual and auditory modalities are usually correlated. For example, seeing the downward motion of a drummer is usually correlated with hearing the drum beat. In some relatively infrequent cases, however, information from the visual and auditory modalities do not match. When this mismatch occurs, the brain engages interesting processes from a Top-Down perspective to make up for these discrepancies between the senses.
Ventriloquism Effect
When an audio-visual mismatch occurs, the brain may decide to reinterpret information from the auditory system such that it matches the visual modality. In a sense, the brain makes the auditory system obey the visual system, so that the resulting percept is of a single representation of a multimodal stimulus. The phenomenon of visual information overriding auditory information is known as visual capture. One demosntration of AudioVisualInteraction, especially of the visual capture of auditory stimuli, is the case of ventriloquism.
Ventriloquism relies on the brain’s tendency to integrate auditory information to agree with the visual system. In a ventrilquism act, the ventriloquist moves the puppet’s mouth while talking without moving his/her lips. Because the puppet is moving while the performer is not, we localize the sound source to the puppet instead of the ventriloquist; thus, we perceive the speech as coming from the puppet.
McGurk Effect
When the auditory and visual systems are uncorrelated, visual capture (such as the VentriloquismEffect) is a typical result. There are some cases, however, when visual capture does not occur. Instead, the brain takes input from both auditory and visual systems, and integrates them to create a unique multimodal percept which is different from either the visual or auditory stimulus alone.
In the lab it is possible to create situations in which the visual and auditory percepts do not match.
A demonstration of the McGurk Effect. To experience the McGurk Effect, play this video clip in three different ways:
normally: both watching and listening to the video (fused condition)
with your eyes shut but while listening to the clip (auditory condition)
with your eyes open but with the sound turned off (visual condition)
The video clip consists of a video of the person saying “ga ga”, dubbed with a voice saying “ba ba”. Thus, when viewing the video with the sound turned off, you should see the person saying “ga ga”, and when listening to the video with your eyes closed you should hjavascript:; doneear “ba ba”. Interestingly, in the fused condition when both looking and listening, most people report hearing “da da”, which is a fusion of “ba ba” and “ga ga”.
The McGurkEffect was first report in 1976 by McGurk and MacDonald, who propose the following explanation for their finding: … in a ga-lips/ba-voice representation, there is visual information for [a] and [da] and auditory information with features common to [ba] and [da]. By responding to the common information in both modalities, a subject would arrive at the unifying percept /da/. (McGurk et al., 1976)
Quiz
What is the McGurk Effect and what does it show about multisensory interaction?
In this unit we emphasized that top-down processing may influence bottom-up - perspectives in important ways. List three ways in which information from the top down may interact with bottom-up processing, and give an example for each.
What does the decibel measure, and how is it calculated from the intensity of a sound in a silent background?
Which tone sounds louder? A 50dB tone at 200 Hz, or a 50dB tone at 2000 Hz? How do we know?
Why might it be evolutionarily advantageous for the auditory system to show the Precedence Effect?
How does the Clifton Effect differ from the Precedence Effect?
How is loudness calculated for a complex tone with a rich harmonic spectrum?
A guitarist plucks a string in a concert hall 30ft in depth. How long does it take for the earliest reflection from the furthest wall to reach her ears? Please refer to the diagram below. guitarreverb.jpg Guitar Reverb
References
- Hirsh, I.J. & Watson, C.S. “Auditory psychophysics and perception”. Annual Reviews of Psychology, 47: 461-484. 1996.
- McGurk, H. & MacDonald, J. “Hearing lips and seeing voices”. Nature, 264: 746-748. 1976.
- Schafer, R.M. “Soundscape: Our sonic environment and the tuning of the world”. Destiny Books. 1993.
- Bregman, A.S. “Auditory Scene Analysis”. MIT Press. 1997.
- Clifton, R.K. “Breakdown of echo suppression in the precedence effect”. Journal of the Acoustical Society of America, 82(5): 1834-1835. 1987.
- Blauert, J. “Spatial Hearing”. MIT Press’. 1983.
- Dent, M.L. & Tolin, D.J. & Yin, T.C.T. “Cats exhibit the Franssen Effect illusion”. Journal of the Acoustical Society of America, 116(5): 3070-3074. 2004.
- Wickens, T.D. “Elementary Signal Detection Theory”. Oxford University Press. 2001.
- Boltz, M.G. “Musical soundtracks as a schematic influence on the cognitive processing of filmed events”. Music Perception. 2001. 10.1525/mp.2001.18.4.427
- Narmour, E. “The Analysis and Cognition of Basic Melodic Structures: The Implication-Realization Model”. University of Chicago Press’. 1990.
- Howard, D.M. & Angus, J. “Acoustics and Psychoacoustics”. Focal Press. 1996.
Authors
Topics
- Elementary Psychoacoustics
- Bottom-Up vs. Top-Down
- Loudness
- Reverberation
- Perceptual Illusions
- Precedence Effect
- Audio-Visual Interaction